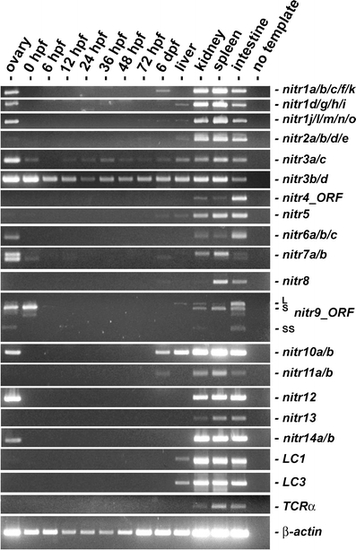
RT-PCR analyses of NITR gene expression from zebrafish ovaries, embryos, and adult tissues. Zebrafish (AB strain) embryos were collected by natural mating and maintained at 28°C as described (Westerfield 2000). Total RNA (2 μg) from pooled embryos at various developmental stages (hours post-fertilization (hpf) or days post fertilization (dpf)) and dissected tissues (pooled from multiple animals) was reverse transcribed (SuperScript™ II Reverse Transcriptase: Invitrogen; Carlsbad, CA) and subjected to thermal cycling with gene-specific primers (Table 1 and Fig. 1) and TITANIUM™ Taq DNA polymerase (Clontech). Primers that amplify the entire open reading frame were utilized for nitr4 and nitr9: note that three mRNA splice variants of nitr9, (Wei et al. 2007) are detected in the kidney and intestine. RT-PCR of immunoglobulin light chains (LC1 and LC3), T cell receptor α (TCR-α) and β-actin are included for reference. TCR-α primers were designed to amplify sequences between the variable (V) and constant (C) domains and thus only detect transcripts, which reflect somatic recombination. The degenerate TCR-α forward primers were designed to detect all V domain sequences encoding the conserved motif: A(V/L)YYCA. Limited RNA blot analyses with polyA+ mRNA from intestine, kidney and spleen, detected transcripts between 1.4-2.0 Kb for the zebrafish nitr1-nitr7 families (unpublished observations)
|
