
FIGURE
Fig. 2
- ID
- ZDB-FIG-090817-46
- Publication
- Curran et al., 2009 - Foxd3 Controls Melanophore Specification in the Zebrafish Neural Crest by Regulation of Mitf
- Other Figures
- All Figure Page
- Back to All Figure Page
Fig. 2
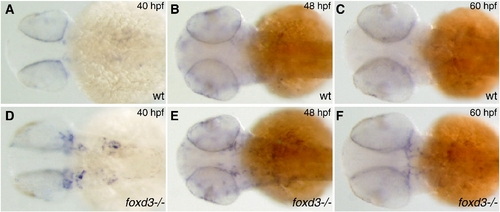
mitfa expression expanded in Foxd3 mutant. mitfa mRNA expanded in head and anterior trunk of Foxd3 mutant. Dorsal view, anterior left, 5x. (A–C) mitfa expression in wild-type zebrafish (D–F) mitfa expression in foxd3-/- (sym1). (A, D) 40 hpf (B, E) 48 hpf (C, F) 60 hpf. |
Expression Data
| Gene: | |
|---|---|
| Fish: | |
| Anatomical Terms: | |
| Stage Range: | Prim-25 to Pec-fin |
Expression Detail
Antibody Labeling
Phenotype Data
Phenotype Detail
Acknowledgments
This image is the copyrighted work of the attributed author or publisher, and
ZFIN has permission only to display this image to its users.
Additional permissions should be obtained from the applicable author or publisher of the image.
Reprinted from Developmental Biology, 332(2), Curran, K., Raible, D.W., and Lister, J.A., Foxd3 Controls Melanophore Specification in the Zebrafish Neural Crest by Regulation of Mitf, 408-417, Copyright (2009) with permission from Elsevier. Full text @ Dev. Biol.