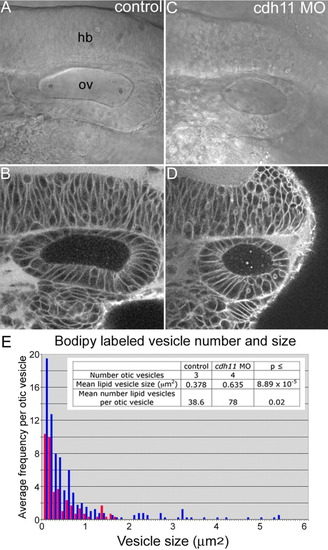
Total number and size of fluorescently labeled vesicular structures increased in Cdh11 knockdown embryos. BODIPY-ceramide labeling of living 20-hpf zebrafish embryos injected with control morpholino oligonucleotide (A, B) and with cdh11 antisense morpholino oligonucleotide-injected embryos (C, D). Transmitted light, DIC microscope images (A, C) and the corresponding confocal optical sections (B, D) are shown, imaged using a Zeiss LSM 510, C-apochromat 63x W 1.2 NA objective, mounted in embryo medium. Single confocal image planes are shown. Fluorescent vesicular structures were quantified using ImageJ software to measure total numbers of vesicular structures and their sizes (for details, see Experimental Procedures section). These numbers were plotted on a frequency distribution graph (E, average frequency of vesicles vs. vesicle size). The table shown as an inset in E lists the number of otic vesicles that were analyzed, the mean lipid vesicle size, and the mean number of lipid vesicles per otic vesicle in control morpholino oligonucleotide-injected (control; red bars) and cdh11 antisense morpholino oligonucleotide-injected (cdh11 MO; blue bars) embryos. Results of the Student′s t-test comparisons of control and cdh11 antisense morpholino oligonucleotide-injected embryo groups were statistically significant. hb, hindbrain; ov, otic vesicle.
|
