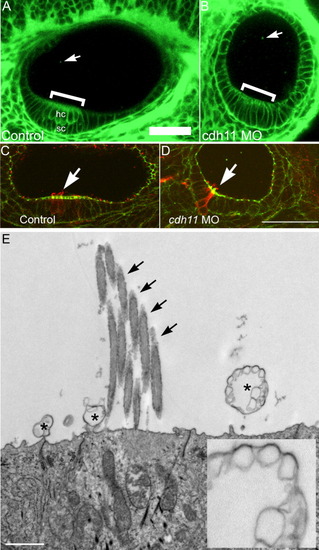
Inner ear epithelial morphology and vesicular structures. BODIPY-ceramide (fluorescent lipid) labeling of living 42-hpf zebrafish embryos and confocal microscopy (A, B) outlines cell surfaces, showing cell shapes of otic epithelial cells. Confocal microscope (Zeiss LSM 510, C-Apochromat 40× W 1.2NA objective, mounted in embryo medium) BODIPY-ceramide fluorescence image planes of a three-dimensional stack are shown (pixels 0.45 μm, z-step 2 μm). The double-layered pseudostratified hair cell (hc) and supporting cell (sc) layers of the sensory patch in control morpholino oligonucleotide-injected embryos (A, indicated by a bracket). The stratification was not detected in cdh11 antisense morpholino oligonucleotide-injected embryos (B), but in these morphant embryos, sensory patches had a thickened appearance (bracket in B). Also, BODIPY-ceramide fluorescence was detected in vesicular structures within the otolymph (arrows in A and B, see also Fig. 5). For A and B, rostral is left, and dorsal is up. Control morpholino oligonucleotide-injected embryo (42 hpf, C) and 42-hpf cdh11 antisense morpholino oligonucleotide-injected embryo (D) were double-labeled using FITC-phalloidin (Molecular Probes) and anti-acetylated tubulin (Sigma) using TRITC-anti mouse secondary antibody (Jackson Labs). We examined several inner ears, and all control and morphant sensory patches had hair cells containing actin-labeled stereocilia and tubulin-labeled kinocilia extending above stereocilia. These are representative images (n=2). Arrows indicate hair cells within the sensory patch. These data also indicate that the kinocilia are present in the cdh11 antisense morpholino oligonucleotide-injected embryo, which are required for attachment of membrane structures subsequent to otolith nucleation (initial attachment of glycogen particles to the kinocilia; Riley et al.,[1997]). Rostral is to the left, and dorsal is up in C and D. Scale bar in A = 50 μm for A-D. Transmission electron microscopy of normal zebrafish otic epithelial cells (E) shows several vesicular structures at their apical surface (asterisk). One vesicular structure that is seen (inset) is quite large and has a multivesicular appearance. Arrows indicate stereocilia of the hair cell bundle.
|
