
FIGURE
Fig. 5
- ID
- ZDB-FIG-090224-20
- Publication
- Li et al., 2009 - Tracking gene expression during zebrafish osteoblast differentiation
- Other Figures
- All Figure Page
- Back to All Figure Page
Fig. 5
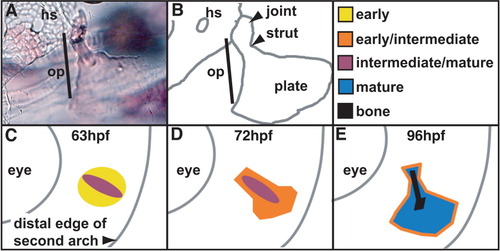
Model for osteoblast differentiation during formation of the opercle. A: Alizarin Red staining of the fan-shaped opercle (op) at 144 hours postfertilization (hpf) showing its connection to the hyosymplectic (hs) cartilage proximally. B: Camera lucida drawing of A showing the joint, strut, and plate of the opercle. C-E: See text for explanation. |
Expression Data
Expression Detail
Antibody Labeling
Phenotype Data
Phenotype Detail
Acknowledgments
This image is the copyrighted work of the attributed author or publisher, and
ZFIN has permission only to display this image to its users.
Additional permissions should be obtained from the applicable author or publisher of the image.
Full text @ Dev. Dyn.