
Fig. 7
- ID
- ZDB-FIG-090220-15
- Publication
- Ota et al., 2009 - The roles of the FGF signal in zebrafish embryos analyzed using constitutive activation and dominant-negative suppression of different FGF receptors
- Other Figures
- All Figure Page
- Back to All Figure Page
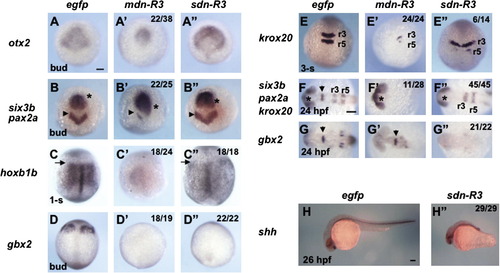
Effects of two types of dominant-negative FGFR3c overexpression on the neural plate regionalization. Embryos were injected with mRNA (300 pg/embryo) for egfp, mdn-R3, or sdn-R3, and examined for the expression of regional marker genes in the neural plate at the bud/ 1-somite stage (A–D, A′–D′, and A″–D″), 3-somite stage (E, E′, and E″), or 24–26 hpf (F–H, F′, G′, and F″–H″). The positions of the forebrain, MHB, and the anterior boundary of r4 are marked with asterisks, triangles, and arrows, respectively. (A–G, A′–G′, and A″–G″) Dorsal views with anterior to the top (A–E, A′–E′, and A″–E″) or to the left (F, G, F′, G′, F″, and G″). (H and H″) Lateral views with anterior to the left and dorsal to the top. Rates of embryos with anomalies are shown at the right top. Scale bars, 100 μm. |
Reprinted from Mechanisms of Development, 126(1-2), Ota, S., Tonou-Fujimori, N., and Yamasu, K., The roles of the FGF signal in zebrafish embryos analyzed using constitutive activation and dominant-negative suppression of different FGF receptors, 1-17, Copyright (2009) with permission from Elsevier. Full text @ Mech. Dev.