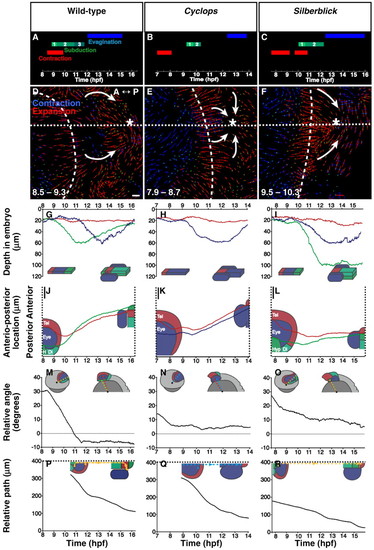
Quantitative comparison of forebrain morphogenesis in wild type, cyc morphant and slb. (A,D,G,J,M,P) Wild type. (B,E,H,K,N,Q) cyc morphant. (C,F,J,L,O,R) slb. Dotted line, midline; dashed line, neural-plate border. (A-C) Timing of principal morphogenetic phases. Keel subduction is subdivided into: 1, moving deep; 2, moving forwards and deep; and 3, moving forwards. (D-F) Neural-plate contraction shown by a measure of tissue deformation. Dorsal view, anterior to left, as indicated. The orientations of deformation vectors show the principal directions and their length proportional to magnitude. Neural and non-neural ectoderm is distinct. In wildtype and cyc morphant embryos, keel initiation (asterisk) is coincident with the focal point of neural-plate contraction (arrows), but in slb these two behaviours are dissociated. (G-I) Depth within the embryo of medial tissue during keel formation. Hypothalamus undergoes subduction in wild type (G) and slb (I); the medial eye field subducts in cyc morphant (H). Telencephalon remains shallow in all cases. (J-L) Locations of the subducting tissues relative to the telencephalon, shown by location along the anterior-posterior axis. (M-O) The same data is plotted as angular positions measured around the great circle along the midline, relative to an arbitrary anterior reference point. (P-R) Rate of eye evagination was measured from the movement of posterior eye-field cells that remain connected to the neural tube, after evagination, relative to their anterior counterparts. These are future optic-stalk cells in wild type (P) and slb (R), and the residual band of retina in cyc morphant (Q). Positions were followed along the path of movement rather than the straight-line distance. Reduced anterior-posterior reorganisation in slb is evident. hpf, hours post fertilisation. (D,F) Time (bottom left-hand corner) in hpf. Colours for A-C,G-R are indicated in A; and for D-F in D. A, anterior; P, posterior. Scale bars: 25 μm.
|
