|
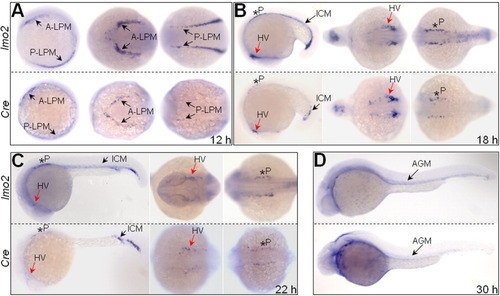
Spatial-temporal expression of Cre mRNAs recapitulates endogenous lmo2 expression. In each panel, lmo2 expression is shown at the top and Cre expression at the bottom. A: At 12 hpf, expression of lmo2 and Cre is firstly detected at A-LPM and P-LPM (arrows). B,C: lmo2 and Cre expression are detected at head vasculature (HV, red arrows), pronephic primordial (P, stars), and ICM (black arrows) at 18 (B) and 22 hpf (C). Embryos in the left, middle, and right are lateral, ventral, and dorsal views, respectively. D: lmo2 and Cre expression are weakly detected at the presumptive AGM (arrows, lateral view). All embryos are shown with heads to the left.
|