
Fig. 2
- ID
- ZDB-FIG-080605-12
- Publication
- Dupuy et al., 2002 - Mammalian germ-line transgenesis by transposition
- Other Figures
- All Figure Page
- Back to All Figure Page
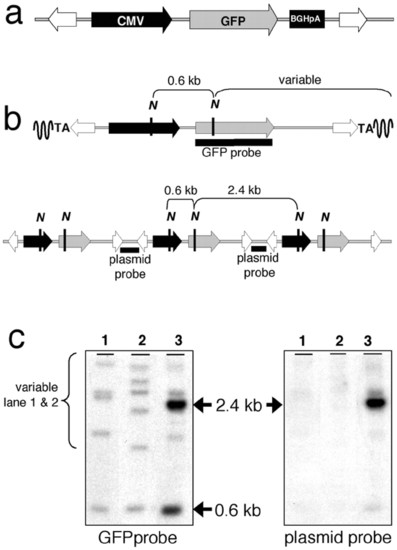
Structure and analysis of transposon integration sites. (a) The structure of the linear transposon that was used for pronuclear injection is shown. The transposon contains a GFP reporter (gray arrow) driven by the immediate early CMV promoter (black arrow) followed by the bovine GH polyadenylation site (black box) and flanked by the IR/DRs (white arrows). (b Upper) The structure of a Sleeping Beauty-mediated integration site including the expected fragments from a NcoI (N) digest. (b Lower) The structure of a random integration site and NcoI restriction map. The probes used for Southern blot analysis are also defined as black bars. (c) Examples of three embryonic DNAs analyzed by Southern blotting are shown. The results shown were achieved with the GFP probe (Left) and the plasmid probe (Right). |