FIGURE

Fig. S2

ID
ZDB-FIG-080604-77
Publication
Peri et al., 2008 - Live Imaging of Neuronal Degradation by Microglia Reveals a Role for v0-ATPase a1 in Phagosomal Fusion In Vivo
Other Figures
All Figure Page
Back to All Figure Page
Fig. S2

GT-MO injected embryos display a phenotype that is comparable with that observed for ATG-MO injected embryos
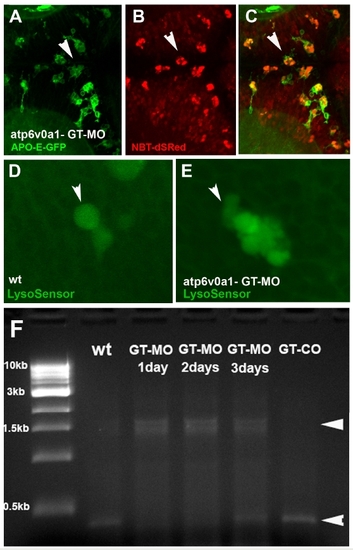
GT-MO morphant brain (A-C). APO-GFP (A), NBT.DsRed (B), merge (C). GT-MO injected embryos display a phenotype that is comparable with that observed for ATG-MO injected embryos (compare with Fig.4 L-O). Both are characterized an increase in the amount of NBT-DSRed neurons present in microglia (compare with Fig.4 H-K). D and E wild-type (D) and GT-MO (E) microglia stained with LysoSesor to label acidic vesicles. Intensity fluorescent values inside single vesicles (white arrowhead) are comparable, indicating normal acidification of these vesicles. (F) Efficacy of morpholino knock-down is confirmed by the 1.5kb size-shift in the transcript produced from the vAtpase gene (white arrowheads).

Expression Data
Genes:
Fish:
Knockdown Reagent:
Anatomical Terms:
Stage: Protruding-mouth

Expression Detail
Antibody Labeling
Phenotype Data
Fish:
Knockdown Reagent:
Observed In:
Stage: Protruding-mouth

Phenotype Detail
Acknowledgments
This image is the copyrighted work of the attributed author or publisher, and ZFIN has permission only to display this image to its users. Additional permissions should be obtained from the applicable author or publisher of the image.

Reprinted from Cell, 133(5), Peri, F., and Nüsslein-Volhard, C., Live Imaging of Neuronal Degradation by Microglia Reveals a Role for v0-ATPase a1 in Phagosomal Fusion In Vivo, 916-927, Copyright (2008) with permission from Elsevier. Full text @ Cell