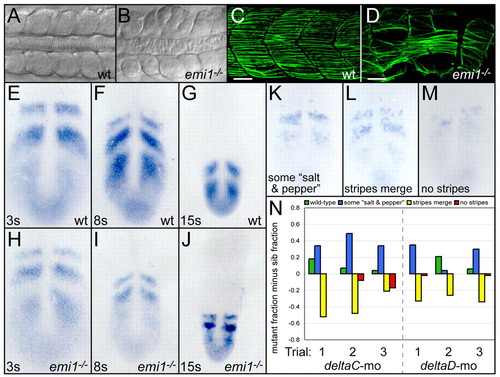
Cell cycle progression is necessary for somitogenesis but not segmentation clock function. (A,B) Dorsal views of anterior trunk somites in wild-type (A) and emi1-/- (B) embryos at the 15-somite stage. (C,D) Posterior trunk myotomes of wild-type (C) and emi1-/- (D) embryos at 36 hpf, lateral views. Slow muscle fibers are labeled with S58 antibodies (green). Scale bars: 30 μm. (E-J) her1 expression at the 3-, 8- and 15-somite stages in (E-G) wild-type and (H-J) emi1-/- embryos. (K-N) her1 stripe integrity was examined in emi1-/- and sibling embryos injected with morpholinos against either deltaC or deltaD. her1 expression was rated according to four categories representing increasing levels of disorganization: wild type; (K) stripes with some `salt and pepper' expression; (L) stripes begin to merge; and (M) no stripes. (N) Distributions of gene expression patterns are displayed for three independent trials (x-axis). Within each gene expression category, the fraction of sibling embryos is subtracted from the fraction of mutant embryos. For example, the wild-type category in the first deltaC morpholino trial included 0.20 fraction of the mutant embryos (20%) and 0.02 fraction of the sibling embryos (2%), giving a graphed value of 0.18. In deltaC morpholino trials, the number of mutants and siblings assayed (mutant/siblings) were: 39/74, 27/79 and 16/57. For deltaD morpholino trials, the corresponding numbers were: 60/50, 28/74 and 49/90. Given the subjective nature of the expression classification, a second assayer performed an independent blind classification of the same embryos (see Fig. S1 in the supplementary material). Although the profiles of the distributions differ, the distinction between emi1 and sibling embryos was consistent. In A-D, anterior is left. In E-M, anterior is up.
|
