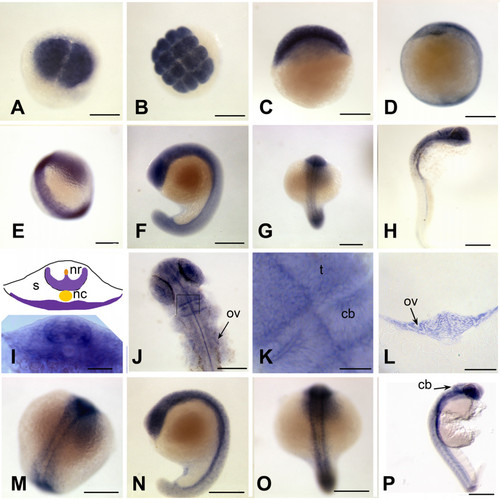
brd2 paralogs are enriched in developing nervous system during segmentation. Whole mount in situ hybridizations to RNA in zebrafish embryos conducted with DIG-labelled zf626 (brd2) (A-L) and zf69 (brd2b) (M-P) cloned sequences. Ubiquitous expression is seen in embryos of 2 cell (A), 16 cell (B), 30% epiboly (C), and bud (D) stages for both brd2 (shown) and brd2b (not shown) genes. Enriched expression in "ladder" patterns along the developing neural keel/rod during segmentation is seen in 14 somite embryos probed for brd2 (E) and for brd2b (M). Cross-sections of 14 somite whole mount embryos probed for brd2 (I, schematic with real image below; 5–6 somite level) show enriched expression in ventrolateral neural rod (nr), floorplate above notochord (nc), and ventral somites (s). Expression is most prominent in head region of 18 somite embyros for both paralogs (F, G; and N, O); only brd2 is also enriched in tail bud (F), while brd2b remains high along the entire ventral trunk (N) at this stage. By 24 hours, brd2 is prominent in the entire head, with some expression in ventral trunk and post-anal tail (H), while brd2b is enriched in ventral brain, cerebellum, and ventral trunk, with low level ubiquitous expression (P). Dorsal flat mounts of 24 hour embryos (J, K) show brd2 expression enriched within caudal tectum (t) at hindbrain-midbrain boundary, within specific cells of the cerebellum (cb) and at the caudal border between cerebellum and rest of hindbrain. The image in (K) is a higher magnification view of a region from another embryo equivalent to the boxed region in J. Expression of brd2 in cells of otic vesicle walls (ov) is apparent both in flat mounts (J) and cross sections at that level (L). Bar = 250 μm for A-H, J, M-P; = 50 μm for I, K; = 100 μm for L.
|
