
Fig. 2
- ID
- ZDB-FIG-080326-7
- Publication
- Pézeron et al., 2008 - Live analysis of endodermal layer formation identifies random walk as a novel gastrulation movement
- Other Figures
- All Figure Page
- Back to All Figure Page
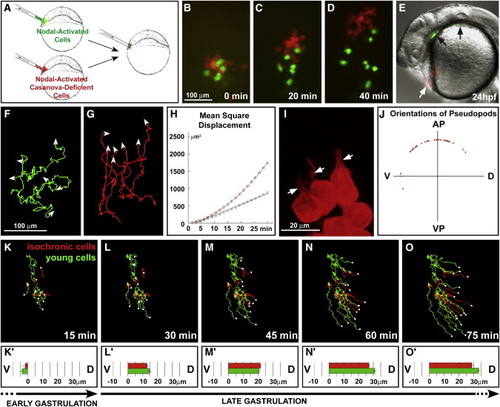
Control of Random Walk Behavior (A–J) Random walk is inducible by Nodal and depends on casanova. In (A), a schematic of the experimental procedure is illustrated. (B–D) Nodal-activated cells (green, Tar* cells) and Nodal-activated cells coinjected with a morpholino against casanova (red, Tar*-MOcasanova cells) were transplanted into wild-type host embryos and monitored during early gastrulation. (E) At 24 hpf, Tar* cells are found within the endoderm (pharynx, black arrows), whereas Tar*-MOcasanova cells contribute to the hatching gland (white arrow). (F and G) Shown are representive examples of 40 min tracks with 1 min intervals of Tar* and Tar*-MOcasanova cells after transplantation. (H) A MSD plot reveals that Tar* cells (green) migrate in a random walk (linear fit, R = 0.996), whereas Tar*-MOcasanova cells (red) display an oriented migration (parabolic fit, R = 0.999). For each population, 30 cells from four embryos were analyzed. (I) Shown is a representive example of Tar*-MOcasanova cell morphology during early gastrulation. Cells develop large cytoplasmic processes (white arrows). In (J), a polar plot illustrates the distribution of the outgrowth positions of pseudopods relative to the cell center of Tar*-MOcasanova cells during early gastrulation. Seventeen cells from three embryos were analyzed over 20 min. (K–O′) Transition to a convergence movement is induced by the embryonic environment. Nodal-activated cells from midblastula (4 hpf) embryos (young cells, green) and late-blastula (5 hpf) embryos (isochronic cells, red) were transplanted into late-blastula (5 hpf) host embryos. Shown is a representative example of four independent experiments. (K–O) Shown are tracks of both cell populations after 15, 30, 45, 60, or 75 min of monitoring. Host midgastrulation (70% epiboly) corresponds to t = 15 min. The white dots indicate the end position of each track. (K′)–(O′) illustrates the mean net displacement toward the dorsal side for each 15 min interval. During host early gastrul2870% epiboly) corresponds to t = 15 min. The white dots indicate the end position of each track. (K′)–(O ion, both cell populations first migrate randomly without any dorsal bias (K′). They simultaneously start to converge dors |