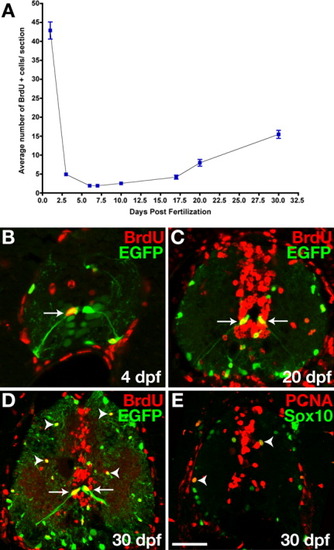
olig2+ spinal cord cells divide at postembryonic stages. All images are single confocal optical sections of transverse sections of 30 dpf Tg(olig2:egfp) zebrafish spinal cords, dorsal up. A: Graph showing average number of BrdU+ spinal cord cells per transverse section at different embryonic and postembryonic stages. Data were compiled from 15-30 sections per timepoint. Bars represent standard error of the mean. B: 4 dpf Tg(olig2:egfp) transgenic larvae pulse-treated with BrdU and labeled with anti-BrdU antibody. Arrows indicate EGFP+ radial glia, which incorporated BrdU. C,D: Twenty- and 30-dpf Tg(olig2:egfp) transgenic fish treated with BrdU repeatedly. Many cells, including EGFP+ radial glia (arrows), bordering the central canal and medial septum incorporated BrdU. Some EGFP+ oligodendrocyte lineage cells were also BrdU+ (arrowheads). E: Double labeling with anti-Sox10 and anti-PCNA antibodies. Sox10+ PCNA+ cells were proliferative OPCs (arrowheads). Scale bar = 30 μM (B,C), 50 μM (D,E).
|
