
Fig. 2
- ID
- ZDB-FIG-071204-26
- Publication
- Li et al., 2007 - Redundant activities of Tfap2a and Tfap2c are required for neural crest induction and development of other non-neural ectoderm derivatives in zebrafish embryos
- Other Figures
- All Figure Page
- Back to All Figure Page
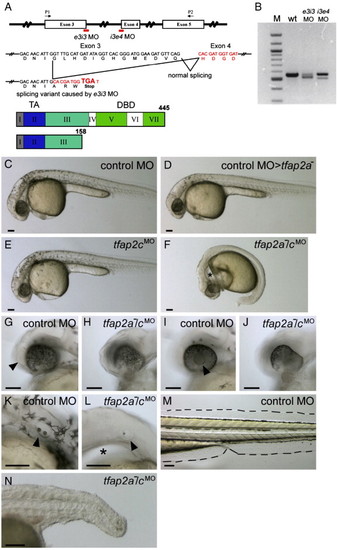
tfap2a mutant embryos injected with tfap2c morpholino (MO) display abnormal development in ectoderm-derived tissues. (A) Top, schematic of the tfap2c gene showing the position of MOs used in this study; middle, effects of the tfap2c e3i3 MO on the tfap2c transcript; bottom, the Tfap2c protein. Roman numerals refer to exons, numbers refer to amino acids. TA, transactivation domain. DBD, DNA binding domain. e3i3 MO targeting the exon 3 splice donor site and i3e4 MO targeting the exon 4 splicing acceptor site are shown in red. P1 and P2 are the primers used for the RT-PCR shown in panel B. tfap2c e3i3 MO causes a deletion of 38 nucleotides, which leads to a frame shift and introduces a stop codon at the end of exon 3. (B) tfap2c RT-PCR results. Amplification of cDNA from uninjected wild-type embryos (wt) with the primers P1 and P2 shown in panel A yielded a single band of the expected size of 557 bp, while amplification of 24 hpf cDNA from tfap2c e3i3 MO injected embryos (e3i3 MO) yielded a smaller band of 519 bp. Amplification of cDNA from tfap2c i3e4 MO injected embryos (i3e4 MO) also yielded a smaller band. M, 100 bp ladder. (C–F) Lateral views of live embryos at 28 hpf. In panel C, a wild-type embryo injected with standard control MO (hereafter, control embryo) with normal morphology and pigmentation. In panel D, a control MO-injected tfap2a homozygous mutant embryo displaying normal morphology but reduced number of melanophores. In panel E, a wild-type embryo injected with tfap2c e3i3 MO with normal morphology and pigmentation. (F) A tfap2a homozygous mutant embryo injected with tfap2c e3i3 MO (hereafter, tfap2a-/cMO embryo), with no visible pigmentation, an absence of yolk extension, a poorly extended tail, and edema ventral to the hindbrain (asterisk). (G–L) Lateral views of the embryos shown in panels C and F at higher magnification. Olfactory placode (arrowhead in panel G) and lens (arrowhead in panel I) are visible in the control embryo but not in the tfap2a-/cMO embryo (H, J) which also displays malformation of the ventral retina. Otic vesicle in panel K, the control embryo, contains two otoliths (arrowhead). While in panel L, the tfap2a-/cMO embryo, it is reduced in size and contains a single otolith (arrowhead). An enlarged view of the edema ventral to the hindbrain is also seen (asterisk). (M, N) Lateral views of the same embryos shown in panels C and F at 72 hpf. Medial fin folds, as outlined in panel M, the control embryo, are virtually absent in panel N, the tfap2a-/cMO embryo. Notochord and somites also appear abnormal, presumably due to indirect effects, because tfap2a and tfap2c expression are not detected in these tissues. Scale bars: 100 μm. |
| Fish: | |
|---|---|
| Knockdown Reagent: | |
| Observed In: | |
| Stage: | Prim-5 |
Reprinted from Developmental Biology, 304(1), Li, W., and Cornell, R.A., Redundant activities of Tfap2a and Tfap2c are required for neural crest induction and development of other non-neural ectoderm derivatives in zebrafish embryos, 338-354, Copyright (2007) with permission from Elsevier. Full text @ Dev. Biol.