
Fig. 2
- ID
- ZDB-FIG-070330-9
- Publication
- Epting et al., 2007 - Expression of rasgef1b in zebrafish
- Other Figures
- All Figure Page
- Back to All Figure Page
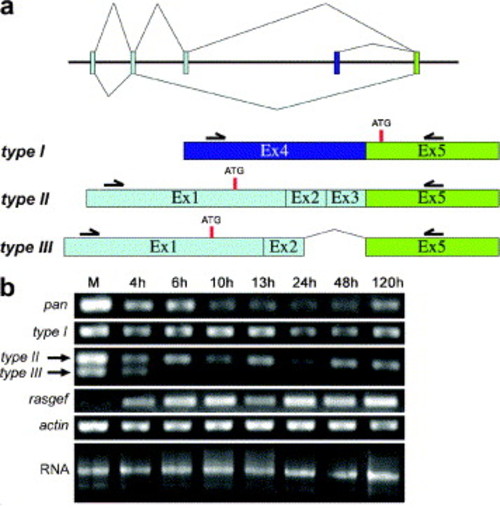
Regulation of three rasgef1b isoforms and rasgef during zebrafish development. (a) Exon structure and splicing scheme of three rasgef1b isoforms, referred as type I, type II and type III. The core domain of all three isoforms consists of exons 5–17 (only exon 5 is shown). Position of primer pairs used for amplification of the different isoforms and the start codons (ATG) are indicated. (b) Semi-quantitative reverse transcriptase PCR analysis of rasgef and rasgef1b transcripts in oocytes (maternal, M) and embryos between 4 and 120 hpf. Amplification products correspond to rasgef1b cDNA of exons 7–11 (pan), exons 4, 5 (type I), exons 1, 2, 3, and 5 (type II) and exons 1, 2, 5 (type III). Loading controls show mRNA (RNA) and RT-PCR amplification of actin cDNA (actin). Note that rasgef1b-type I and -type II show constant expression from oogenesis until 120 hpf while expression of rasgef1b-type III decreases over time. |
| Genes: | |
|---|---|
| Fish: | |
| Anatomical Terms: | |
| Stage Range: | Sphere to Adult |
Reprinted from Gene expression patterns : GEP, 7(4), Epting, D., Vorwerk, S., Hageman, A., and Meyer, D., Expression of rasgef1b in zebrafish, 389-395, Copyright (2007) with permission from Elsevier. Full text @ Gene Expr. Patterns