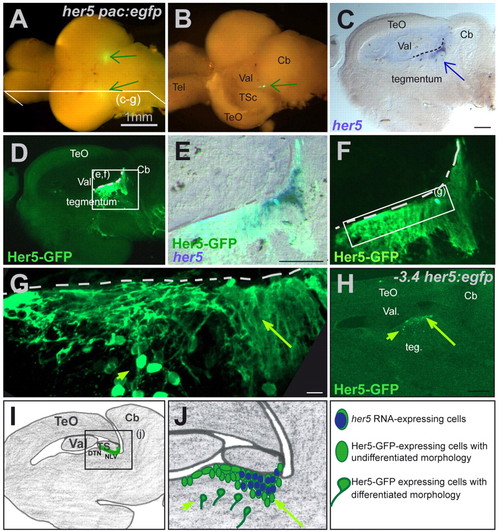
her5 expression defines an MHB cluster in the adult brain. (A) Whole brain from a 4-month-old her5pac:egfp transgenic fish viewed from the top. Two spots of GFP expression (green arrows) are visible between the hindbrain and the midbrain hemispheres. (B) Same brain following unilateral removal of the tectum. On the dissected side, the cluster of GFP-positive cells (arrow) is visible between the valvula cerebelli and torus semicircularis. (C-F) Sagittal section of a 2.5-month-old her5pac:egfp fish depicting the expression of endogenous her5 RNA (blue staining) in a group of cells included within the cluster of Her5-GFP-expressing cells (green staining). (C) Brightfield view: her5 is expressed in a cluster of cells lining the ventricle (dotted line) between tegmentum, torus semicircularis and valvula cerebelli (arrow), like Her5-GFP (D,F, fluorescence view). (E) her5-expressing cells are indeed located within the Her5-GFP-positive domain (concomitant bright and fluorescence fields). Note also, in E, that GFP-positive cells are located ventrally outside the her5-positive zone. (G) High magnification of the Her5-GFP-positive area (dotted line to the ventricle), highlighting the neuroepithelial morphology of ventricular her5 RNA- and Her5-GFP-positive cells (long arrow), contrasting with the differentiated morphology of their more ventrally located her5-negative, Her5-GFP-positive descendants (short arrow). (H) Her5-GFP expression in a sagittal section of a 2.5-month-old -3,4her5:egfp transgenic brain. Her5-GFP expression highlights the same territory as in her5pac:egfp transgenics. In particular, positive cells of neuroepithelial morphology lie at the ventricle (long arrow), while cells of differentiated morphology are found deeper within the tegmentum (short arrow). (I,J) Schematic representation of a sagittal section at the same medio-lateral position as the sections shown in C-H. The green line in I depicts the her5-expressing area, and her5- or Her5-GFP-positive cells are colour-coded in J (long arrow to the her5- and Her5-GFP-positive domain, short arrow to the her5-negative, Her5-GFP-positive domain, as in G,H). Scale bars: 1 mm in A,B; 100 μm in C,D,H; 10 μm in G. Cb, cerebellum; DTN, dorsal thalamic nucleus; NLV, nucleus lateralis valvulae; Teg, tegmentum; Tel, telencephalon; TeO, optic tectum; TSc, torus semi-circularis; Val, valvula cerebelli lateralis.
|
