|
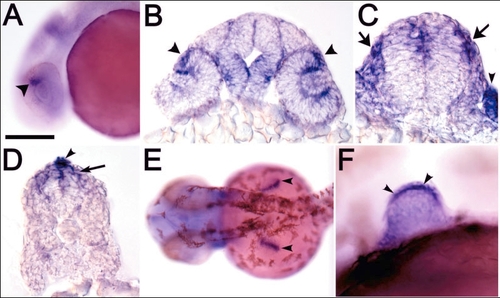
Expression of tcf7 in specific regions at 24-36 hours postfertilization (hpf). A: Expression in dorsal retina (arrowhead) at 24 hpf. Lateral view, anterior to left. B: Coronal section through the diencephalon at 24 hpf. Higher level of expression in margin of the dorsal retina (arrowheads) and ventral diencephalon. C: Coronal section through the anterior hindbrain at 24 hpf. Expression in dorsal hindbrain, neural crest (arrows), and otic vesicle (arrowhead). D: Coronal section through spinal cord at 24 hpf. tcf7 expression is seen in dorsal spinal cord (arrow) and median fin fold (arrowhead). E,F: Expression in pectoral fin apical fold ectoderm at 36 hpf. E: Dorsal view of fin buds, indicated by arrowheads. F: Lateral view of pectoral fin bud showing high level of expression in basal layer ectodermal cells (arrowheads). Apical cells are unstained. Scale bar in A = 300 μm in A,E, 175 μm in B-D, 100 μm in F.
|