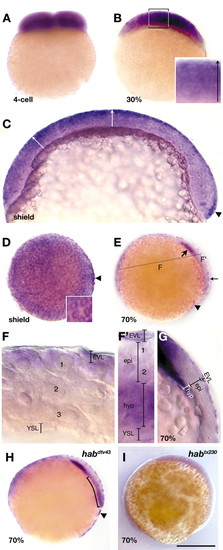
Whole-mount in situ hybridization show that hab expression becomes progressively restricted to superficial layers of the blastoderm. (A) Optical cross-section of 4-cell stage. (B) Hand-section of 30% epiboly stage. Inset, higher magnification of boxed region showing a radial gradient (arrow) of hab expression in the epiblast, highest superficially. (C) Medial sagittal section of shield stage embryo, dorsal to the right. Arrows indicate the gradient of hab expression on the ventral side and at the animal pole. Note clearing on dorsal side, except for the thin line of expression in the EVL. Arrowhead indicates region of intense hab expression in the forerunner precursors. (D) Animal pole view of shield stage embryo showing high levels of hab expressed in the EVL, and the intense expression in the forerunner cells (arrowhead). Inset shows higher power view, showing nuclei surrounded by rings of hab expression (E) Medial sagittal section at 70% showing high levels of hab expressed in the anterior axial hypoblast (thick arrow), the EVL (thin arrow), and the forerunner cells (arrowhead), and absence of hab expression in the axial epiblast. (F,F′) High magnification views of embryo in E. Hand sections are along plane indicated by dashed line in E. (F) Lateral transverse section, showing a radial gradient of hab expression in the epiblast, highest in superficial layer adjacent to the EVL. At this location, the hypoblast has not yet moved under the epiblast. The numbers indicate approximate layers. (F′) Dorsal transverse section, showing absence of hab expression in axial epiblast cells, and strong expression in anterior axial hypoblast near the level of the prechordal plate. At this stage, the midline of the neural epithelium is about two cells thick. (G) Medial sagittal section at 70% over stained to show the expression in the EVL, and the clearing in the axial epiblast. (H) Optical cross-section of 70% epiboly habdtv43/dtv43 missense mutant showing raised levels of hab mRNA found in the blastoderm. Note intense expression in the forerunner clusters (arrowhead). Curved bracket indicates heightened expression in the hypoblast. Embryos in H and E are siblings. (I) Optical cross-section of 70% epiboly habtx230/tx230 nonsense mutant showing lowered levels of hab mRNA found in the embryo. epi, epiblast; hyp, hypoblast; YSL, yolk syncytial layer. Numbers indicate cell layers of the epiblast. Scale bar: 100 µm in C; 20 µm in F,F′; 75 µm in G; 250 µm in all others.
|
