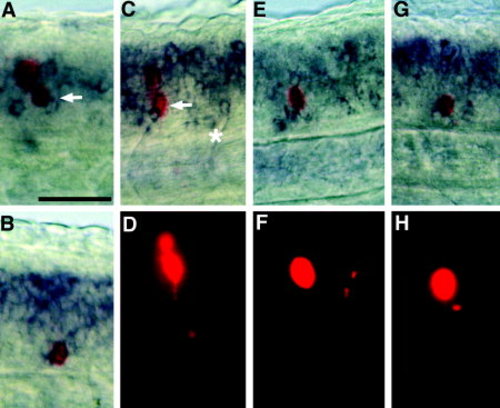
iro3 is expressed by all motoneuron subtypes and by VeLD interneurons. Lateral trunk views of wild-type embryos at 24 hours postfertilization. Individual neurons were labeled with a mixture of fluorescein dextran and rhodamine dextran and then embryos with labeled neurons were processed for iro3 in situ hybridization (blue) and anti-fluorescein antibody staining (red). A-H: Shown are brightfield images (A-C,E,G) and fluorescent images (D,F,H). A: A labeled RoP that expresses iro3. B: A labeled SMN that expresses iro3. C,D: The same labeled CaP that expresses iro3. At this stage of development, CaP cell bodies have often moved dorsally, so that, like this example, they are now much closer to somite boundaries (Myers et al., [1986]). E,F: The same labeled MiP that expresses iro3. G,H: The same labeled VeLD that expresses iro3. In both A and C, the PMN is the more ventral of the two labeled cells and is indicated with white arrows; the more dorsal cells were inadvertently labeled by the pipette en route to the PMN. A,B: The labeled neuron was identified after the staining procedures by comparing its location with the previously recorded locations and identities of labeled cells in that embryo (see Experimental Procedures section). C: The white star indicates a small group of iro3-expressing ventral cells near the somite boundary (see text; this finding can be seen more clearly in Fig. 4A). Scale bar = 50 μm in A (applies to A-H).
|
