
- Title
-
Expression domains of a zebrafish homologue of the Drosophila pair-rule gene hairy correspond to primordia of alternating somites
- Authors
- Muller, M., Von, Weizsacker, E., and Campos-Ortega, J.A.
- Source
- Full text @ Development
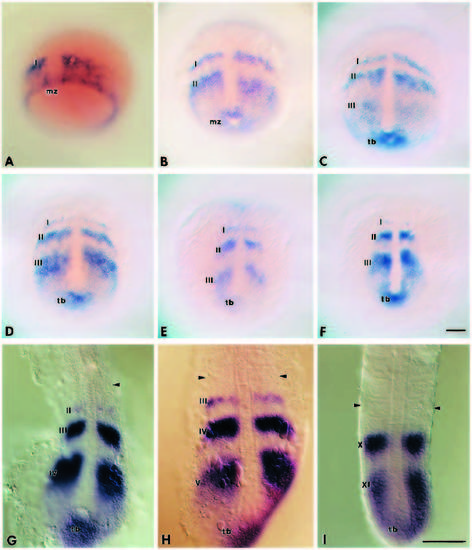
Distribution of her1 transcripts in late gastrulation and postgastrulation stages. (A-I) In situ hybridizations of embryos at 75% epiboly (A), 95% epiboly (B), 1- (C), 2- (D), 3- (E), 4- (F), 5- (G), 7- (H) and 21-somite (I) stages. During rostral displacement, the expression domains become narrower. As a consequence of convergence, the domain shapes change from stripes during gastrulation to compact blocks, in postgastrulation stages. Arrowheads in G, H and I point to the 5th, 7th and 21st somites, respectively. I-XI designate the corresponding expression domains. Anterior is to the top in all panels. mz, marginal expression zone; tb, tail bud. A-F and G-I, same magnification. Scale bars, 100 μm. EXPRESSION / LABELING:
|

Cells within the epibolic margin and the tail bud have not been allocated to somites. (A) Fluorescence micrograph of an injection in the hypoblast (arrow) at 80% epiboly. (B-D; 14-somite stage) show examples of the labelling resulting from injections as in A. These embryos were processed for in situ hybridization with digoxigenin-labelled RNA probes followed by anti-fluorescein antibody staining. (B) Fluorescein-labelled cells (brown, arrows) are located in the 9th somite; (D) fluorescein-labelled cells within expression domain VIII. (C) An embryo, in which hypoblastic and epiblastic cells were injected. The former have produced progeny distributed throughout somites 6- 8 (two arrows), the latter contributed to the neural tube, in the presumptive territory of the 19th segment (one arrow). (E) Labelled cells (antifluorescein staining) in somites 15-19, following an injection in the tail bud at 100% epiboly. B and C, same magnification. Scale bars: 100 μm. |
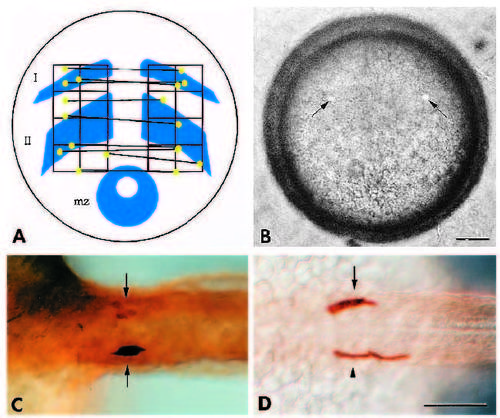
Mesodermal cells in front of the marginal domain are already allocated to somites. (A) The diagram shows the position of cell pairs (yellow dots) injected at about the same anteroposterior level anterior to the marginal domain (mz) at 100% epiboly. Injections in a given embryo are linked. The graticule used for injections (see Materials and Methods) and the presumed location of the expression domains are projected onto the positions of the injected cells. (B) Fluorescence micrograph of a 100% epiboly embryo immediately after injection of hypoblast cells bilaterally at the same anteroposterior level (arrows). (C) In five cases, single cell injections were made on both sides; labelled cells (arrows) were restricted to the same somite on both sides. (D) In the remaining four embryos, two or more cells were injected on at least one side. In one embryo, labelling was restricted to the same somite on both sides; in the other three, progeny cells were found unilaterally in neighbouring somites; however, in each of these cases labelled cells were also within the same somite on both sides. C and D, same magnification. Scale bars, 100 μm. |
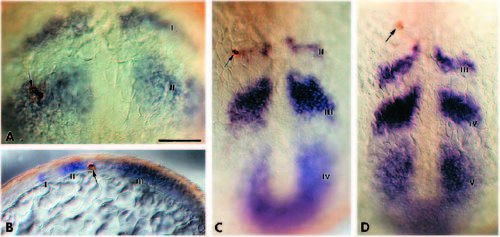
Expression domains correspond to somitic primordia. (A) An embryo injected (three brown cells at the arrow) in expression domain II at 100% epiboly. This embryo is one of the control cases and was processed for in situ hybridization and anti-fluorescein antibody staining immediately after injection. (B) A parasagittal section (~100 μm) of a 3- somite stage embryo that had been injected in domain II at 100% epiboly. The arrow points to a labelled cell caudally in domain II. (C) A double-stained 6-somite embryo (whole mount) following an injection in domain II at 100% epiboly. Labelled cells are located within domain II, immediately posterior to the 6th somite (no clearly visible). (D) A double-stained 7-somite stage (whole mount) following an injection in domain II at 100% epiboly. Labelled cells are located within the 7th somite. I-V, expression domains. Scale bar, 100 μm. |
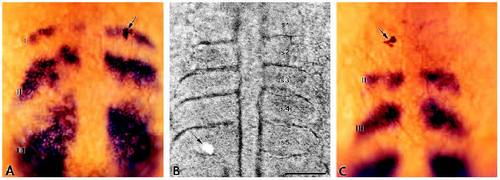
Expression domains delineate somitic primordia. (A) An injection in expression domain I (three brown cells at the arrow) in an embryo at the 3- somite stage. This embryo is one of the control cases, and was processed for in situ hybridization and anti-fluorescein antibody staining immediately after injection. (B) A fluorescence micrograph of an embryo in 5-somite stage that had been injected in domain I at the 3-somite stage. Labelling (arrow) is clearly visible within the 5th somite. (C) The same embryo after in situ hybridization and antifluorescein staining. I-III, expression domains. Scale bar, 100 μm. |