FIGURE SUMMARY
Title

DNA methyltransferase Dnmt3ba-mediated epigenetic modulation of Integrin signaling is essential for hematopoietic stem and progenitor cell development

Authors
Ai, K., Wu, Y., Liang, G., Kong, H., Yang, X., Li, N., Liu, Z., Dong, Y., Xu, J., Zhang, L., Chen, X., Fu, Y., Wang, L., Li, L.
Source
Full text @ Commun Biol

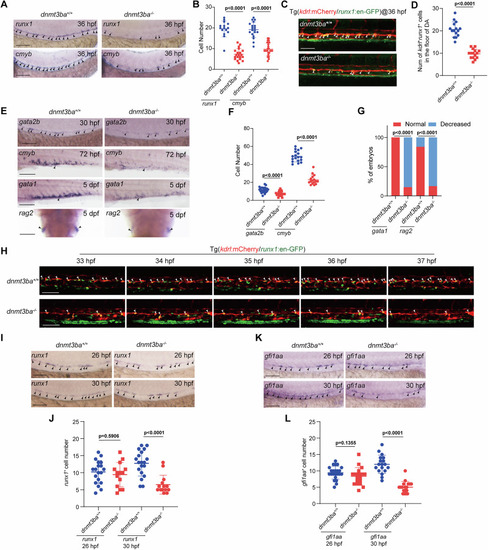
Dnmt3ba is required for EHT and HSPC development.

A WISH showing the expression of runx1 and cmyb (arrowheads) in the VDA region of WT and dnmt3ba mutant embryos at 36 hpf. Three independent experiments were conducted. B Quantification of runx1+ cells (n = 15 (dnmt3ba+/+), 20 (dnmt3ba/) embryos) and cmyb+ cells (n = 19 (dnmt3ba+/+), 24 (dnmt3ba/) embryos). C Confocal imaging shows the kdrl+runx1+ HECs (white arrowheads) in the VDA region of WT and dnmt3ba mutant embryos with Tg(kdrl:mCherry/runx1:en-GFP) background at 36 hpf. Three independent experiments were conducted. D Quantification of the number of kdrl+runx1+ HECs (n = 15 (dnmt3ba+/+), 15 (dnmt3ba/) embryos). E WISH showing expression of HEC marker gata2b (arrowheads) in the VDA region at 30 hpf, HSPC marker cmyb (arrowheads) in the CHT region at 72 hpf, erythroid marker gata1 in the CHT region, and lymphoid marker rag2 (arrowheads) in the thymus region at 5 dpf in WT and dnmt3ba mutant embryos, respectively. Three independent experiments were conducted. F Quantification of gata2b+ cells (n = 22 (dnmt3ba+/+), 22 (dnmt3ba/) embryos) and cmyb+ cells (n = 18 (dnmt3ba+/+), 16 (dnmt3ba/) embryos). G Quantification of embryos with indicated expression pattern of gata1 (n = 20 (dnmt3ba+/+), 20 (dnmt3ba/) embryos) and rag2 (n = 20 (dnmt3ba+/+), 24 (dnmt3ba/) embryos) at 5 dpf. H Snapshot of EHT (arrowheads) in WT and dnmt3ba mutant embryos with Tg(kdrl:mCherry/runx1:en-GFP) background from 33 hpf to 37 hpf. I and K WISH showing the expression of runx1 and gfi1aa in the VDA region of WT and dnmt3ba mutant embryos. Three independent experiments were conducted. J Quantification of runx1+ cells at 26 hpf (n = 19 (dnmt3ba+/+), 19 (dnmt3ba/) embryos) and runx1+ cells (n = 19 (dnmt3ba+/+), 14 (dnmt3ba/) embryos at 30 hpf). L Quantification of gfi1aa+ cells (n = 23 (dnmt3ba+/+), 18 (dnmt3ba/) embryos at 26 hpf) and gfi1aa+ cells (n = 18 (dnmt3ba+/+), 18 (dnmt3ba/) embryos at 30 hpf). Scale bars, 100 µm. Statistical significance was determined by a Two-tailed Student’s t-test in (B, D, F, J, L) and a Two-tailed Fisher’s exact test in (G), respectively. Data are presented as mean ± SD.

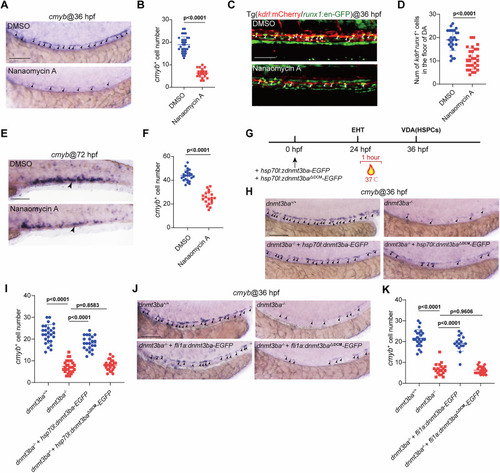
The DNA methyltransferase activity of Dnmt3ba is required for HSPC development.

A WISH at 36 hpf showing the embryos treated with Nanaomycin A at 24 hpf impaired the expression of HSPC marker cmyb (arrowheads) in the VDA region. Three independent experiments were conducted. B Quantification of cmyb+ cells (n = 32 (DMSO), 20 (Nanaomycin A) embryos). C Confocal imaging shows the kdrl+runx1+ HECs (white arrowheads) in the VDA region of DMSO or Nanaomycin A-treated embryos with Tg(kdrl:mCherry/runx1:en-GFP) background at 36 hpf. Three independent experiments were conducted. D Quantification of the number of kdrl+runx1+ HECs (n = 25 (DMSO), 28 (Nanaomycin A) embryos). E WISH showing the expression of HSPC marker cmyb (arrowheads) in the CHT region of DMSO or Nanaomycin A-treated embryos at 72 hpf. Three independent experiments were conducted. F Quantification of cmyb+ cells (n = 24 (DMSO), 19 (Nanaomycin A) embryos). G Schematic representation of heat-shock strategy to temporally and transiently express dnmt3ba or dnmt3ba△DCM at the beginning of EHT (24–32 hpf). H WISH showing the expression of cmyb (arrowheads) at 36 hpf in WT, dnmt3ba mutants, and dnmt3ba mutants injected with hsp70l:dnmt3ba-EGFP or hsp70l:dnmt3ba△DCM-EGFP construct, respectively. Three independent experiments were conducted. I Quantification of cmyb+ cells (n = 26 (dnmt3ba+/+), 26 (dnmt3ba/), 22 (dnmt3ba/+hsp70l:dnmt3ba), 25 (dnmt3ba/+hsp70l:dnmt3ba△DCM) embryos). J WISH showing the expression of cmyb (arrowheads) at 36 hpf in WT, dnmt3ba mutants, and dnmt3ba mutants injected with fli1a:dnmt3ba-EGFP or fli1a:dnmt3ba△DCM-EGFP construct, respectively. Three independent experiments were conducted. K Quantification of cmyb+ cells (n = 23 (dnmt3ba+/+), 19 (dnmt3ba/), 16 (dnmt3ba/+fli1a:dnmt3ba), 21 (dnmt3ba/+fli1a:dnmt3ba△DCM) embryos). Scale bars, 100 µm. Statistical significance was determined by a Two-tailed Student’s t-test in (B, D, F) and a One-way ANOVA in (I, K), respectively. Data are presented as mean ± SD.

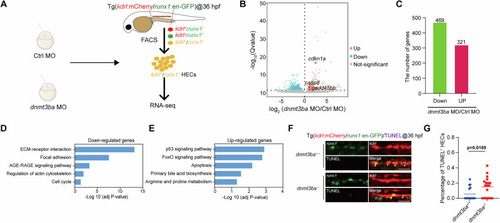
Transcriptomic analysis of dnmt3ba-deficient HECs.

A Schematic representation of the strategy used for cell preparation and RNA-seq in kdrl+runx1+ HECs in the VDA region of control and dnmt3ba morphants at 36 hpf. B Volcano plots showing the differentially expressed genes in HECs between control and dnmt3ba morphants with |log2FC | ≥ 1 and q-value < 0.05. C The number of upregulated and downregulated genes in HECs in dnmt3ba morphants compared to controls at 36 hpf. D KEGG analysis for the downregulated genes in dnmt3ba morphants. E KEGG analysis for the upregulated genes in dnmt3ba morphants. F TUNEL assay showing the apoptotic HECs (yellow arrowheads) in the VDA region of control and dnmt3ba mutants with Tg(kdrl:mCherry/runx1:en-GFP) background at 36 hpf. White arrowheads indicate HECs. Three independent experiments were conducted. G Quantification of the percentage of apoptotic HECs relative to total viable HECs (apoptotic HECs/total viable HECs × 100%) (n = 16 (dnmt3ba+/+), 18 (dnmt3ba/) embryos). Scale bars, 50 µm. In (G), statistical significance was determined by a Two-tailed Student’s t-test.

dnmt3ba deficiency reduces methylation and expression level of Integrin signaling genes.

A The genomic distribution of hypermethylated and hypomethylated DMRs in dnmt3ba morphants compared to controls. B Venn diagram exhibiting the overlap between downregulated genes and genes with Hypo-DMRs in gene body regions in dnmt3ba morphants. C KEGG analysis for the overlapping genes in (B). D qRT-PCR analysis of itgα3b, itgα7, and lamb2 expression in HECs in control and dnmt3ba morphants at 36 hpf. Three independent experiments were conducted. E qRT-PCR analysis of gene expression in HECs in WT and dnmt3ba mutants at 36 hpf. Three independent experiments were conducted. FI Bisulfite sequencing analysis and quantification of DNA methylation levels at DMRs in itgα3b and itgα7 in HECs of control and dnmt3ba morphants at 36 hpf. Three independent experiments were conducted. JM Bisulfite sequencing analysis and quantification of DNA methylation levels at DMRs in itgα3b and itgα7 in ECs/HECs of WT or dnmt3ba mutants at 36 hpf. Three independent experiments were conducted. Statistical significance was determined by a Two-tailed Student’s t-test in (D, E) and a Two-tailed Fisher’s exact test in (G, I, K, M). Data are presented as mean ± SD.

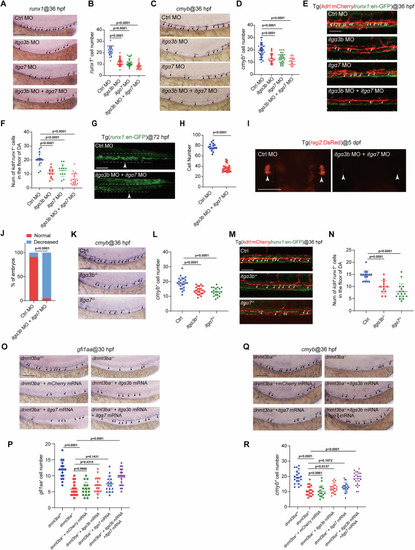
HSPC development is impaired in itgα3b/itgα7-deficient embryos.

A WISH showing the expression of HSPC marker runx1 (arrowheads) in the VDA region of control, itgα3b morphants, itgα7 morphants, and itgα3b+itgα7 morphants at 36 hpf. Three independent experiments were conducted. B Quantification of runx1+ cells (n = 24 (ctrl), 36 (itgα3b MO), 35 (itgα7 MO), 41 (itgα3b MO+itgα7 MO) embryos). C WISH showing the expression of HSPC marker cmyb (arrowheads) in the VDA region of control, itgα3b morphants, itgα7 morphants, and itgα3b+itgα7 morphants at 36 hpf. Three independent experiments were conducted. D Quantification of cmyb+ cells (n = 42 (ctrl), 22 (itgα3b MO), 30 (itgα7 MO), 24 (itgα3b MO+itgα7 MO) embryos). Confocal imaging shows the kdrl+runx1+ HECs (white arrowheads) in the VDA region of control, itgα3b morphants, itgα7 morphants, and itgα3b+itgα7 morphants with Tg(kdrl:mCherry/runx1:en-GFP) background at 36 hpf (E), and quantification of the number of kdrl+runx1+ HECs (n = 16 (ctrl), 12 (itgα3b MO), 12 (itgα7 MO), 21 (itgα3b MO+itgα7 MO) embryos) in (F). Three independent experiments were conducted. Confocal imaging shows runx1+ HSPCs (white arrowheads) in the CHT region of control and itgα3b+itgα7 morphants with Tg(runx1:en-GFP) background at 72 hpf (G), and quantification of runx1+ cells in CHT (n = 16 (ctrl), 25 (itgα3b MO+itgα7 MO) embryos) in (H). Three independent experiments were conducted. I, J Confocal imaging shows rag2+ lymphocytes (white arrowheads) in the thymus of control and itgα3b+itgα7 morphants with Tg(rag2:DsRed) background at 5 dpf (I), and quantification of Tg(rag2:DsRed) embryos as indicated fluorescence intensity (n = 22 (ctrl), 21 (itgα3b MO+itgα7 MO)). Three independent experiments were conducted. K WISH showing the expression of HSPC marker cmyb (arrowheads) in the VDA region of control, itgα3b mutants, and itgα7 mutants at 36 hpf. Three independent experiments were conducted. L Quantification of cmyb+ cells (n = 24 (ctrl), 22 (itgα3b/), 20 (itgα7/) embryos). M Confocal imaging shows the kdrl+runx1+ HECs (white arrowheads) at 36 hpf in the VDA region of control, itgα3b mutants, and itgα7 mutants with Tg(kdrl:mCherry/runx1:en-GFP) background. Three independent experiments were conducted. N Quantification of the number of kdrl+runx1+ HECs (n = 15 (ctrl), 12 (itgα3b/), 17 (itgα7/) embryos). O WISH showing the expression of HEC marker gfi1aa (arrowheads) at 36 hpf in WT, dnmt3ba mutants, dnmt3ba mutants injected with mCherry mRNA, dnmt3ba mutants injected with itgα3b mRNA, dnmt3ba mutants injected with itgα7 mRNA, and dnmt3ba mutants injected with itgα3b+itgα7 mRNA. P Quantification of gfi1aa+ cells (n = 17 (dnmt3ba+/+), 18 (dnmt3ba/), 16 (dnmt3ba/+mCherry), 17 (dnmt3ba/+itgα3b), 16 (dnmt3ba/+itgα7), 20 (dnmt3ba/+itgα3b+itgα7) embryos at 30 hpf). Q WISH showing the expression of HSPC marker cmyb (arrowheads) at 36 hpf in WT, dnmt3ba mutants, dnmt3ba mutants injected with mCherry mRNA, dnmt3ba mutants injected with itgα3b mRNA, dnmt3ba mutants injected with itgα7 mRNA, and dnmt3ba mutants injected with itgα3b+itgα7 mRNA. Three independent experiments were conducted. R Quantification of cmyb+ cells (n = 20 (dnmt3ba+/+), 19 (dnmt3ba/), 16 (dnmt3ba/+mCherry), 22 (dnmt3ba/+itgα3b), 22 (dnmt3ba/+itgα7), 22 (dnmt3ba/+itgα3b+itgα7) embryos). Scale bars, 100 µm. Statistical significance was determined by a Two-tailed Student’s t-test in (H), One-way ANOVA in (B, D, F, L, N, P, R), and a Two-tailed Fisher’s exact test in (J), respectively. Data are presented as mean ± SD.

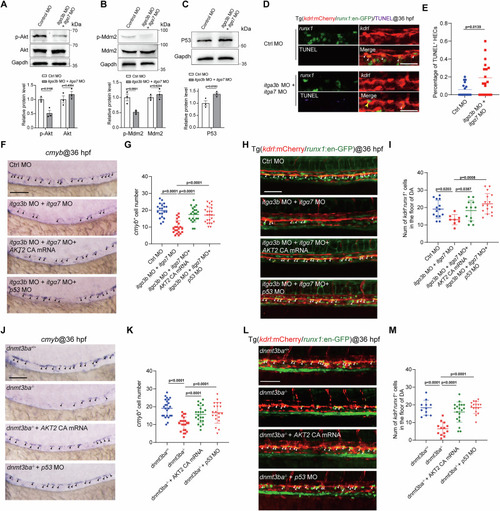
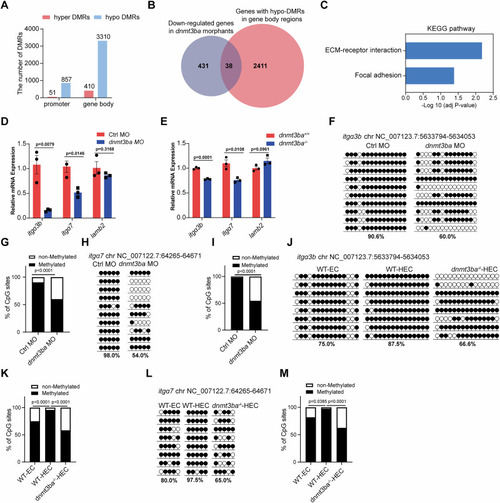
Integrin signaling controls HSPC development through regulating the Akt and P53 pathways.

A WB showing the protein levels of Gapdh, Akt, and p-Akt in control and itgα3b+itgα7 morphants at 36 hpf. Each sample pool contained 5 embryos. Three independent experiments were conducted. B WB showing the protein levels of Gapdh and Mdm2 and p-Mdm2 in control and itgα3b+itgα7 morphants at 36 hpf. Each sample pool contained 5 embryos. Three independent experiments were conducted. C WB showing the protein levels of Gapdh and P53 in control and itgα3b+itgα7 morphants at 36 hpf. Each sample pool contained 5 embryos. Three independent experiments were conducted. D TUNEL assay shows the apoptotic HEC cells (yellow arrowheads) in the VDA region of control and itgα3b+itgα7 morphants with Tg(kdrl:mCherry/runx1:en-GFP) background at 36 hpf. Three independent experiments were conducted. E Quantification of TUNEL+ HEC cells (n = 16 (ctrl), 18 (itgα3b MO+itgα7 MO) embryos). F WISH showing the expression of HSPC marker cmyb (arrowheads) at 36 hpf in the VDA region of control, itgα3b+itgα7 morphants, and itgα3b+itgα7 morphants injected with AKT2 CA mRNA or p53 MO. Three independent experiments were conducted. G Quantification of cmyb+ cells (n = 20 (ctrl), 21 (itgα3b MO+itgα7 MO), 21 (itgα3b MO+itgα7 MO + AKT), 23 (itgα3b MO+itgα7 MO+p53 MO) embryos). H Confocal imaging shows the kdrl+runx1+ HECs (white arrowheads) at 36 hpf in the VDA region of control, itgα3b+itgα7 morphants, and itgα3b+itgα7 morphants injected with AKT2 CA mRNA or p53 MO with Tg(kdrl:mCherry/runx1:en-GFP) background. Three independent experiments were conducted. I Quantification of the number of kdrl+runx1+ HECs (n = 14 (ctrl), 8 (itgα3b MO+itgα7 MO), 12 (itgα3b MO+itgα7 MO + AKT), 16 (itgα3b MO+itgα7 MO+p53 MO) embryos). J WISH showing the expression of HSPC marker cmyb (arrowheads) at 36 hpf in the VDA region of WT, dnmt3ba mutants, and dnmt3ba mutants injected with AKT2 CA mRNA or p53 MO. Three independent experiments were conducted. K Quantification of cmyb+ cells (n = 24 (dnmt3ba+/+), 22 (dnmt3ba/), 22 (dnmt3ba/+AKT), 20 (dnmt3ba/+p53 MO) embryos). L Confocal imaging shows the kdrl+runx1+ HECs (white arrowheads) at 36 hpf in the VDA region of WT, dnmt3ba mutants, and dnmt3ba mutants injected with AKT2 CA mRNA or p53 MO with Tg(kdrl:mCherry/runx1:en-GFP) background. Three independent experiments were conducted. M Quantification of the number of kdrl+runx1+ HECs (n = 11 (dnmt3ba+/+), 13 (dnmt3ba/), 19 (dnmt3ba/+AKT), 16 (dnmt3ba/+p53 MO) embryos). Scale bars, 100 µm. Statistical significance was determined by a Two-tailed Student’s t-test in (A, B, C, E) and a One-way ANOVA in (G, I, K, M), respectively. Data are presented as mean ± SD.

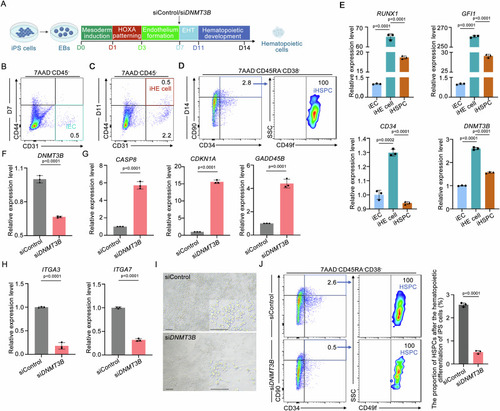
DNMT3B knockdown impairs the iHSPCs generation during hematopoietic differentiation from human iPS cells in vitro.

A Schematic diagram showing hematopoietic differentiation cultures of human iPS cells. DNMT3B or control siRNA was added on day (D) 7 of EHT. B Representative FACS analysis showing the frequency of induced ECs (iECs, CD31+CD44CD457AAD) during hematopoietic differentiation on D7. C Representative FACS analysis showing the frequency of induced HE cells (iHE cells, CD31+CD44+CD457AAD) during hematopoietic differentiation on D11. D Representative FACS analysis showing the frequency of induced HSPCs (iHSPCs, CD34+CD90+CD49f+CD38CD45RA7AAD) during hematopoietic differentiation on D14. E qPCR analysis of the expression of hemogenic-related genes (RUNX1, GFI1, and CD34) and DNMT3B in iECs, iHE cells, and iHSPCs. F qPCR showing the expression of DNMT3B on D8 in siDNMT3B-treated Embryoid bodies (EBs) and siControl-treated EBs. G qPCR showing the expression of CASP8, CDKN1A, and GADD45B on D11 in siDNMT3B-treated iHE cells and siControl-treated iHE cells. H qPCR showing the expression of ITGA3 and ITGA7 on D11 in siDNMT3B-treated iHE cells and siControl-treated iHE cells. I Microscopy images showing fewer round hematopoietic cells generated from iPS cells in the siDNMT3B-treated group during hematopoietic differentiation on D14. J Flow cytometry analysis showing a reduced frequency of induced HSPCs (iHSPCs, CD34+CD90+CD49f+CD38CD45RA7AAD) on D14. (Left) Representative flow cytometry plots. (Right) Quantification of flow cytometry analysis. Scale bars, 50 µm. Statistical significance was determined by a Two-tailed Student’s t-test. Data are presented as mean ± SD.

Acknowledgments
This image is the copyrighted work of the attributed author or publisher, and ZFIN has permission only to display this image to its users. Additional permissions should be obtained from the applicable author or publisher of the image. Full text @ Commun Biol