|
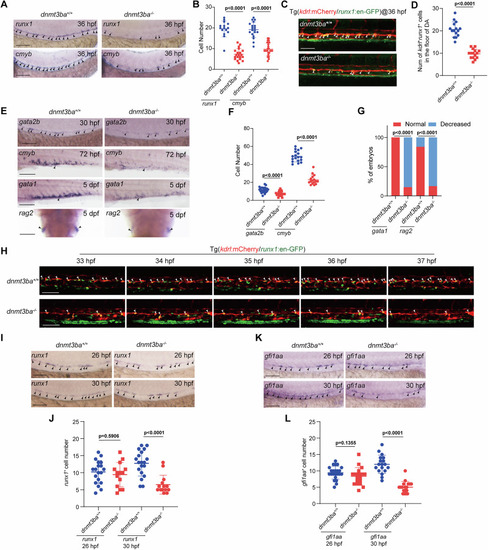
Dnmt3ba is required for EHT and HSPC development. A WISH showing the expression of runx1 and cmyb (arrowheads) in the VDA region of WT and dnmt3ba mutant embryos at 36 hpf. Three independent experiments were conducted. B Quantification of runx1+ cells (n = 15 (dnmt3ba+/+), 20 (dnmt3ba−/−) embryos) and cmyb+ cells (n = 19 (dnmt3ba+/+), 24 (dnmt3ba−/−) embryos). C Confocal imaging shows the kdrl+runx1+ HECs (white arrowheads) in the VDA region of WT and dnmt3ba mutant embryos with Tg(kdrl:mCherry/runx1:en-GFP) background at 36 hpf. Three independent experiments were conducted. D Quantification of the number of kdrl+runx1+ HECs (n = 15 (dnmt3ba+/+), 15 (dnmt3ba−/−) embryos). E WISH showing expression of HEC marker gata2b (arrowheads) in the VDA region at 30 hpf, HSPC marker cmyb (arrowheads) in the CHT region at 72 hpf, erythroid marker gata1 in the CHT region, and lymphoid marker rag2 (arrowheads) in the thymus region at 5 dpf in WT and dnmt3ba mutant embryos, respectively. Three independent experiments were conducted. F Quantification of gata2b+ cells (n = 22 (dnmt3ba+/+), 22 (dnmt3ba−/−) embryos) and cmyb+ cells (n = 18 (dnmt3ba+/+), 16 (dnmt3ba−/−) embryos). G Quantification of embryos with indicated expression pattern of gata1 (n = 20 (dnmt3ba+/+), 20 (dnmt3ba−/−) embryos) and rag2 (n = 20 (dnmt3ba+/+), 24 (dnmt3ba−/−) embryos) at 5 dpf. H Snapshot of EHT (arrowheads) in WT and dnmt3ba mutant embryos with Tg(kdrl:mCherry/runx1:en-GFP) background from 33 hpf to 37 hpf. I and K WISH showing the expression of runx1 and gfi1aa in the VDA region of WT and dnmt3ba mutant embryos. Three independent experiments were conducted. J Quantification of runx1+ cells at 26 hpf (n = 19 (dnmt3ba+/+), 19 (dnmt3ba−/−) embryos) and runx1+ cells (n = 19 (dnmt3ba+/+), 14 (dnmt3ba−/−) embryos at 30 hpf). L Quantification of gfi1aa+ cells (n = 23 (dnmt3ba+/+), 18 (dnmt3ba−/−) embryos at 26 hpf) and gfi1aa+ cells (n = 18 (dnmt3ba+/+), 18 (dnmt3ba−/−) embryos at 30 hpf). Scale bars, 100 µm. Statistical significance was determined by a Two-tailed Student’s t-test in (B, D, F, J, L) and a Two-tailed Fisher’s exact test in (G), respectively. Data are presented as mean ± SD.
|