IMAGE

Fig. 6

ID
ZDB-IMAGE-251121-14
Source
Figures for Ai et al., 2025
Image
Figure Caption

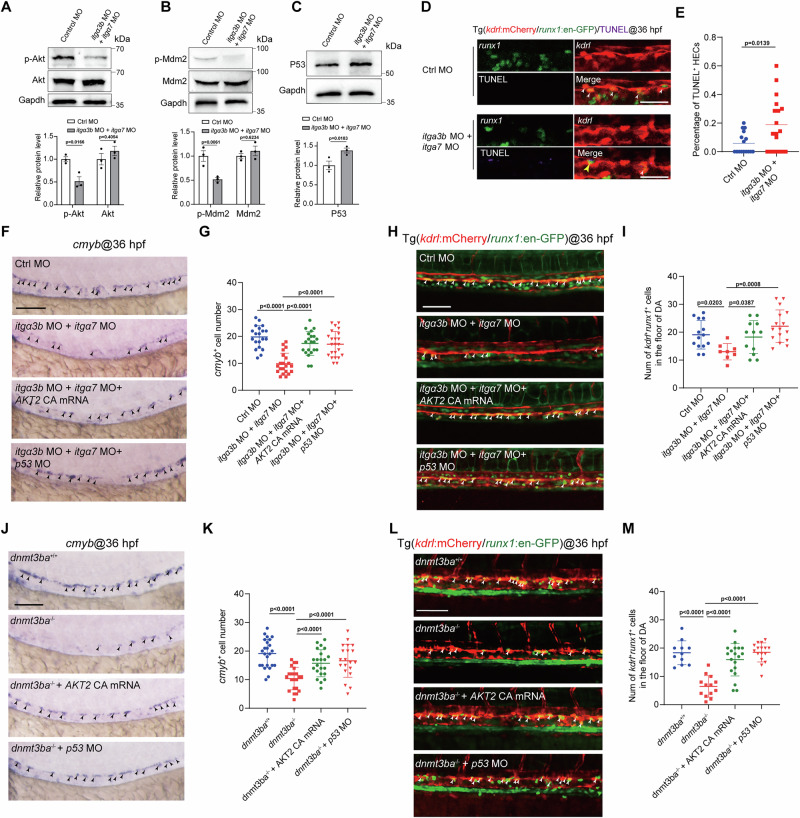
Fig. 6 Integrin signaling controls HSPC development through regulating the Akt and P53 pathways.

A WB showing the protein levels of Gapdh, Akt, and p-Akt in control and itgα3b+itgα7 morphants at 36 hpf. Each sample pool contained 5 embryos. Three independent experiments were conducted. B WB showing the protein levels of Gapdh and Mdm2 and p-Mdm2 in control and itgα3b+itgα7 morphants at 36 hpf. Each sample pool contained 5 embryos. Three independent experiments were conducted. C WB showing the protein levels of Gapdh and P53 in control and itgα3b+itgα7 morphants at 36 hpf. Each sample pool contained 5 embryos. Three independent experiments were conducted. D TUNEL assay shows the apoptotic HEC cells (yellow arrowheads) in the VDA region of control and itgα3b+itgα7 morphants with Tg(kdrl:mCherry/runx1:en-GFP) background at 36 hpf. Three independent experiments were conducted. E Quantification of TUNEL+ HEC cells (n = 16 (ctrl), 18 (itgα3b MO+itgα7 MO) embryos). F WISH showing the expression of HSPC marker cmyb (arrowheads) at 36 hpf in the VDA region of control, itgα3b+itgα7 morphants, and itgα3b+itgα7 morphants injected with AKT2 CA mRNA or p53 MO. Three independent experiments were conducted. G Quantification of cmyb+ cells (n = 20 (ctrl), 21 (itgα3b MO+itgα7 MO), 21 (itgα3b MO+itgα7 MO + AKT), 23 (itgα3b MO+itgα7 MO+p53 MO) embryos). H Confocal imaging shows the kdrl+runx1+ HECs (white arrowheads) at 36 hpf in the VDA region of control, itgα3b+itgα7 morphants, and itgα3b+itgα7 morphants injected with AKT2 CA mRNA or p53 MO with Tg(kdrl:mCherry/runx1:en-GFP) background. Three independent experiments were conducted. I Quantification of the number of kdrl+runx1+ HECs (n = 14 (ctrl), 8 (itgα3b MO+itgα7 MO), 12 (itgα3b MO+itgα7 MO + AKT), 16 (itgα3b MO+itgα7 MO+p53 MO) embryos). J WISH showing the expression of HSPC marker cmyb (arrowheads) at 36 hpf in the VDA region of WT, dnmt3ba mutants, and dnmt3ba mutants injected with AKT2 CA mRNA or p53 MO. Three independent experiments were conducted. K Quantification of cmyb+ cells (n = 24 (dnmt3ba+/+), 22 (dnmt3ba/), 22 (dnmt3ba/+AKT), 20 (dnmt3ba/+p53 MO) embryos). L Confocal imaging shows the kdrl+runx1+ HECs (white arrowheads) at 36 hpf in the VDA region of WT, dnmt3ba mutants, and dnmt3ba mutants injected with AKT2 CA mRNA or p53 MO with Tg(kdrl:mCherry/runx1:en-GFP) background. Three independent experiments were conducted. M Quantification of the number of kdrl+runx1+ HECs (n = 11 (dnmt3ba+/+), 13 (dnmt3ba/), 19 (dnmt3ba/+AKT), 16 (dnmt3ba/+p53 MO) embryos). Scale bars, 100 µm. Statistical significance was determined by a Two-tailed Student’s t-test in (A, B, C, E) and a One-way ANOVA in (G, I, K, M), respectively. Data are presented as mean ± SD.

Acknowledgments
This image is the copyrighted work of the attributed author or publisher, and ZFIN has permission only to display this image to its users. Additional permissions should be obtained from the applicable author or publisher of the image. Full text @ Commun Biol