IMAGE

Fig. 3

ID
ZDB-IMAGE-251121-11
Source
Figures for Ai et al., 2025
Image
Figure Caption

Fig. 3 
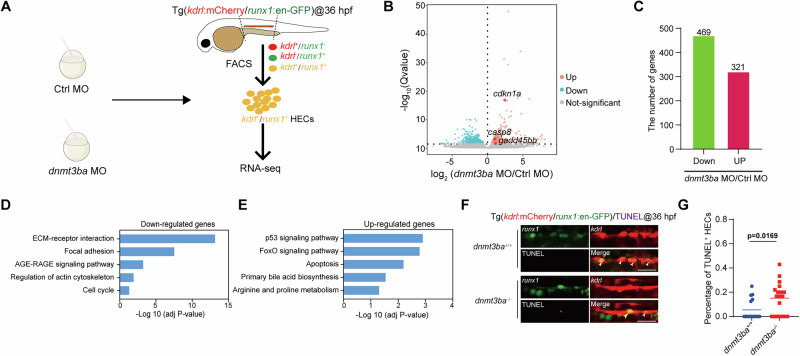
Transcriptomic analysis of dnmt3ba-deficient HECs.

A Schematic representation of the strategy used for cell preparation and RNA-seq in kdrl+runx1+ HECs in the VDA region of control and dnmt3ba morphants at 36 hpf. B Volcano plots showing the differentially expressed genes in HECs between control and dnmt3ba morphants with |log2FC | ≥ 1 and q-value < 0.05. C The number of upregulated and downregulated genes in HECs in dnmt3ba morphants compared to controls at 36 hpf. D KEGG analysis for the downregulated genes in dnmt3ba morphants. E KEGG analysis for the upregulated genes in dnmt3ba morphants. F TUNEL assay showing the apoptotic HECs (yellow arrowheads) in the VDA region of control and dnmt3ba mutants with Tg(kdrl:mCherry/runx1:en-GFP) background at 36 hpf. White arrowheads indicate HECs. Three independent experiments were conducted. G Quantification of the percentage of apoptotic HECs relative to total viable HECs (apoptotic HECs/total viable HECs × 100%) (n = 16 (dnmt3ba+/+), 18 (dnmt3ba/) embryos). Scale bars, 50 µm. In (G), statistical significance was determined by a Two-tailed Student’s t-test.

Acknowledgments
This image is the copyrighted work of the attributed author or publisher, and ZFIN has permission only to display this image to its users. Additional permissions should be obtained from the applicable author or publisher of the image. Full text @ Commun Biol