FIGURE SUMMARY
Title

Zagociguat prevented stressor-induced neuromuscular dysfunction, improved mitochondrial physiology, and increased exercise capacity in diverse mitochondrial respiratory chain disease zebrafish models

Authors
Burg, L., Yoon, H., Peng, M., Germano, P., Reesey Gretzmacher, E., Xiao, R., Anderson, V.E., Nakamaru-Ogiso, E., Falk, M.J.
Source
Full text @ Front Pharmacol

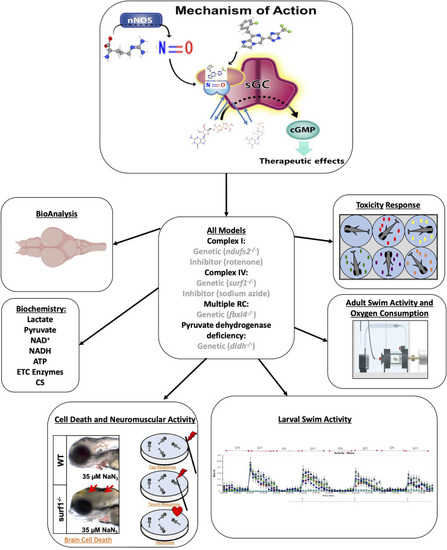
Evaluation of zag in multiple zebrafish models of mitochondrial dysfunction. Zag is a small-molecule sGC stimulator (structure at top) that increases NO-sGC-cGMP signaling. Here, we tested zag in multiple larval and adult zebrafish genetic and/or pharmacologic models of mitochondrial disease (center). Toxicity was evaluated in larval fish, and accumulation analysis (BioAnalysis) was performed on adult zebrafish brain and tail muscle. The larval models were evaluated for cell death, as evidenced by the presence of a gray brain and neuromuscular activity (lower left and upper right), swimming activity (lower right), and classical biochemical markers (middle left). The adult models were evaluated in swim activity assays (middle right, Loligo swim tunnels) while measuring oxygen consumption during a defined exercise protocol.

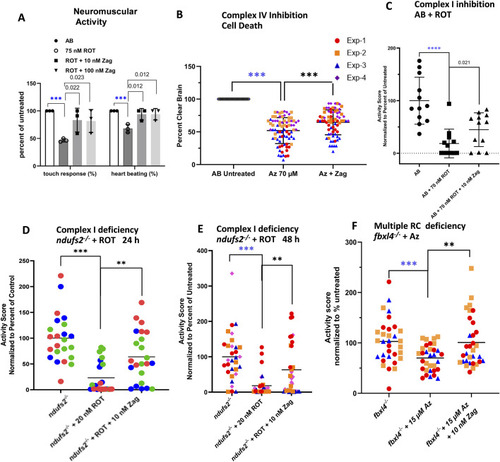
Zag rescues neuromuscular deficits in pharmacological models of complex I and complex IV deficiency. (A) Evaluation of complex I pharmacologic model (AB+ ROT) for touch response and presence of heartbeat demonstrates that zag at both 10 and 100 nM significantly rescued the toxicity of 75 nM ROT; graph indicates the mean and standard deviation of three biological replicates, with n = 10 for each replicate. P-value threshold was p < 0.025 after Bonferroni correction for two comparisons. (B) Complex IV inhibition by 70 µM azide (Az) resulted in brain cell death that, in turn, was rescued significantly by 10 nM zag n ∼ 15 for each of four biological replicates; mean ± std. dev shown. P-value threshold was p < 0.05. (C–E) Swim activity of larvae was rescued in three separate models of PMD. (C) ROT inhibition (70 nM) of complex I in WT larvae demonstrated a loss of ∼80%, which was rescued by an over 2-fold increase in the residual activity. P-value threshold was p < 0.05. (D,E) In ndufs2−/− larvae, additional stress introduced by the presence of 20 nM ROT for 24 or 48 h resulted in a swim activity reduction of ∼80% or 90%, respectively, which was rescued over 4-fold by 10 nM Zag; aggregate means of four biological replicates, with n∼10 each replicate represented by different colors and shapes for each time. (F) In multiple complex-deficient fbxl4−/− larvae, additional stress introduced by 15 µM azide resulted in a ∼40% reduction in swim activity that was fully rescued by the presence of 10 nM Zag in three separate biological replicates; the data points are differentiated by different color and shape. P-value threshold was p < 0.025 after Bonferroni correction of two comparisons for (D–F). In each experiment, the four separate replicates are differentiated by different data point colors and shapes. Zag-treated cohort, where the data points are colored based on replicate. Mean ± std. dev for the four aggregated replicates are shown. For all multiple testing using the Bonferroni correction, the QC comparison (i.e., untreated WT vs. poisoned) was excluded, as it served a different purpose. The significance level for this comparison was indicated separately by blue stars (A,C).

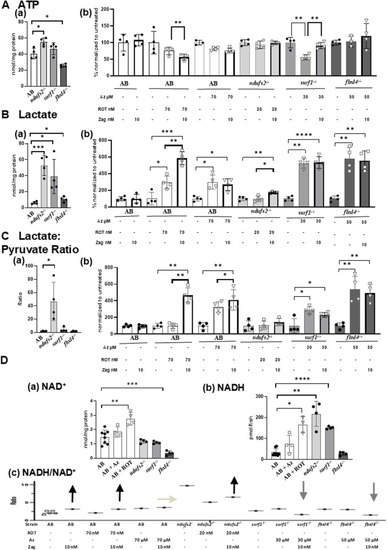
Effects of zag treatment on ATP, lactate, lactate/pyruvate, and NADH/NAD levels in pharmacological and genetic models of complex I and complex IV deficiency. (A)(a) Basal ATP contents at 7 dpf in genetic models: AB (white), ndufs2−/− (light gray), surf1−/− (gray), and fbxl4−/− (dark gray). (B) Change of ATP levels after stressor (ROT or azide) with or without zag (10 nM) treatment compared to that in non-treated animals. Graphs indicate mean and standard deviation of n = 4 biological replicates. Student’s t-test, *p < 0.05, and **p < 0.01. (B)(a) Basal lactate contents at 7 dpf in genetic models: AB (white), ndufs2−/− (light gray), surf1−/− (gray), and fbxl4−/− (dark gray). (B) Change of lactate levels after stressor (ROT or azide) with or without zag (10 nM) treatment compared to that in non-treated animals. Graphs indicate mean and standard deviation of n = 4 biological replicates. Student’s t-test, *p < 0.05, *p < 0.01, ***p < 0.001, and ****p < 0.0001. (C)(a) Basal lactate to pyruvate ratio at 7 dpf in genetic models: AB (white), ndufs2−/− (light gray), surf1−/− (gray), and fbxl4−/− (dark gray). (B) Change of lactate-to-pyruvate ratio after stressor (ROT or Az) with or without zag (10 nM) treatment compared to that in non-treated animals. Graphs indicate mean and standard deviation of n = 4 biological replicates. Student’s t-test, *p < 0.05, and **p < 0.01. (D)(a) NAD contents at 7 dpf in pharmacological and genetic models: AB (solid circle), AB+ ROT (70 nM) (square), AB+ azide (70 μM) (triangle), ndufs2−/− (light gray), surf1−/− (gray), and fbxl4−/− (dark gray). (B) NADH contents at 7 dpf in pharmacological and genetic models: AB (solid circle), AB+ ROT (70 nM) (square), AB+ azide (70 μM) (triangle), ndufs2−/− (light gray), surf1−/− (gray), and fbxl4−/− (dark gray). NADH levels were normalized by fish numbers. (C) NADH to NAD+ ratio (NADH/NAD+) at 7 dpf in pharmacological and genetic models after stressor (ROT or azide) with or without zag (10 nM) treatment. Representative NADH/NAD+ ratios were calculated using average data for NAD+ and NADH contents normalized by fish numbers for each condition (n = 4 biological replicates) due to the difficulty of obtaining NAD+ and NADH measurements from the same homogenate. For non-treated AB, five different sets of NAD+ and NADH averaged from n = 4 biological replicates for each set were shown, assuring that the variation is very low. Arrows indicate the direction of zag effects on the NADH/NAD+ ratio. (A)(b), (B)(b), and (C)(b): unstressed (black circle), zag treated (bold outline), ROT (square), and azide (triangle).

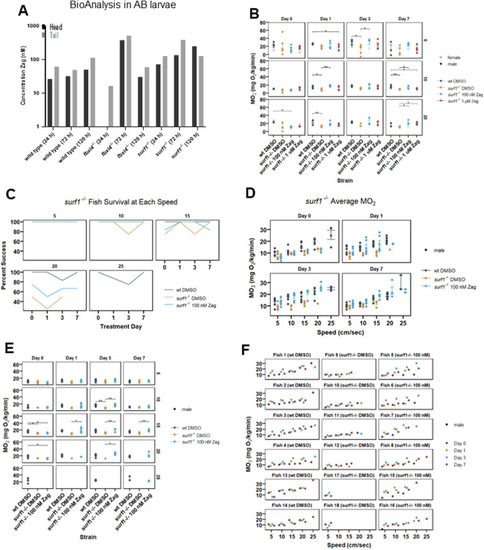
Zag accumulates in adult zebrafish brain and tail muscle while affecting adult swim capacity and oxygen consumption rate in surf1−/− but not fbxl4−/− adult fish. (A) BioAnalysis of adult zebrafish brain and tail muscle tissues confirms that zag enters the zebrafish muscle and brain after incubation in the water for 24–72 h. There is a trend toward increasing concentrations in both tissues with time. At 24 h, in the fbxl4−/− mutant, the level was below the detection limit. n = 1 animal at each timepoint. (B) Individual adult zebrafish are introduced into the swim tunnel designed to have a constant current across the cross-sectional area that can be remotely controlled. The zebrafish instinctively swim against the current until fatigued. In this experiment, the current speed was incrementally increased between 0 and 20 cm/s, as shown. (C) At 5 cm/s, 100% of zebrafish successfully completed the swim, and the data appear as a single line. In surf1−/− mutants, the ability to swim at 15 cm/s and higher currents diminished compared to that in WT. (D–F) Six months post fertilization fish were used in the second replicate with additional current speeds. While actively swimming, the tunnel can be closed to air, and oxygen depletion can be measured. The MO2 is plotted for individual fish as a function of current. The points are colored to distinguish mutation and treatment, as shown in the legend, and the shape distinguishes sex. (D) Each of the four subpanels identifies the days of zag treatment. (E) Each panel is separated by length of treatment (days) and swim speed (cm/s). The x-axis is MO2, and the y-axis is the treatment group for each panel. (F) Each panel is separated by an individual fish, with treatments listed in parentheses. The x-axis is water speed (cm/s), and the y-axis is MO2 for each panel. The colored dots (see legend) denote the different days that each fish was swum.

Acknowledgments
This image is the copyrighted work of the attributed author or publisher, and ZFIN has permission only to display this image to its users. Additional permissions should be obtained from the applicable author or publisher of the image. Full text @ Front Pharmacol