IMAGE

FIGURE 2

ID
ZDB-IMAGE-250814-38
Source
Figures for Burg et al., 2025
Image
Figure Caption

FIGURE 2

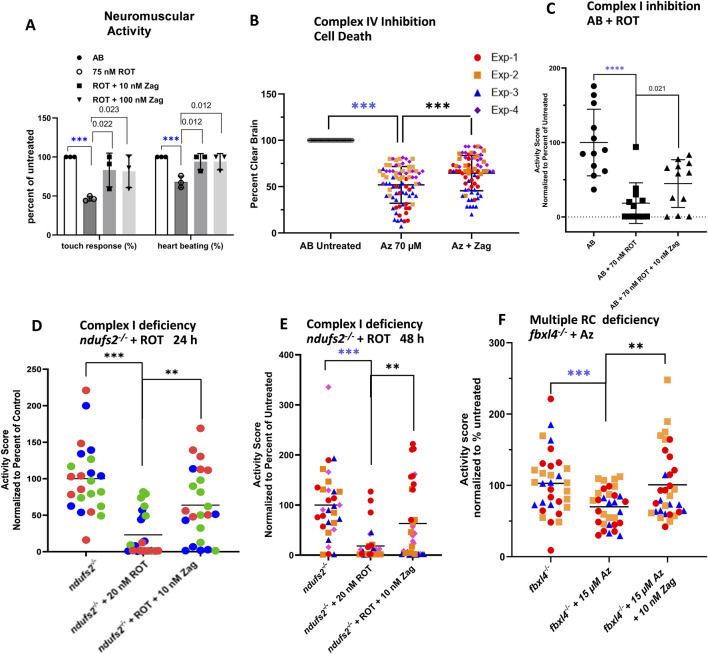
Zag rescues neuromuscular deficits in pharmacological models of complex I and complex IV deficiency. (A) Evaluation of complex I pharmacologic model (AB+ ROT) for touch response and presence of heartbeat demonstrates that zag at both 10 and 100 nM significantly rescued the toxicity of 75 nM ROT; graph indicates the mean and standard deviation of three biological replicates, with n = 10 for each replicate. P-value threshold was p < 0.025 after Bonferroni correction for two comparisons. (B) Complex IV inhibition by 70 µM azide (Az) resulted in brain cell death that, in turn, was rescued significantly by 10 nM zag n ∼ 15 for each of four biological replicates; mean ± std. dev shown. P-value threshold was p < 0.05. (C–E) Swim activity of larvae was rescued in three separate models of PMD. (C) ROT inhibition (70 nM) of complex I in WT larvae demonstrated a loss of ∼80%, which was rescued by an over 2-fold increase in the residual activity. P-value threshold was p < 0.05. (D,E) In ndufs2−/− larvae, additional stress introduced by the presence of 20 nM ROT for 24 or 48 h resulted in a swim activity reduction of ∼80% or 90%, respectively, which was rescued over 4-fold by 10 nM Zag; aggregate means of four biological replicates, with n∼10 each replicate represented by different colors and shapes for each time. (F) In multiple complex-deficient fbxl4−/− larvae, additional stress introduced by 15 µM azide resulted in a ∼40% reduction in swim activity that was fully rescued by the presence of 10 nM Zag in three separate biological replicates; the data points are differentiated by different color and shape. P-value threshold was p < 0.025 after Bonferroni correction of two comparisons for (D–F). In each experiment, the four separate replicates are differentiated by different data point colors and shapes. Zag-treated cohort, where the data points are colored based on replicate. Mean ± std. dev for the four aggregated replicates are shown. For all multiple testing using the Bonferroni correction, the QC comparison (i.e., untreated WT vs. poisoned) was excluded, as it served a different purpose. The significance level for this comparison was indicated separately by blue stars (A,C).

Acknowledgments
This image is the copyrighted work of the attributed author or publisher, and ZFIN has permission only to display this image to its users. Additional permissions should be obtained from the applicable author or publisher of the image. Full text @ Front Pharmacol