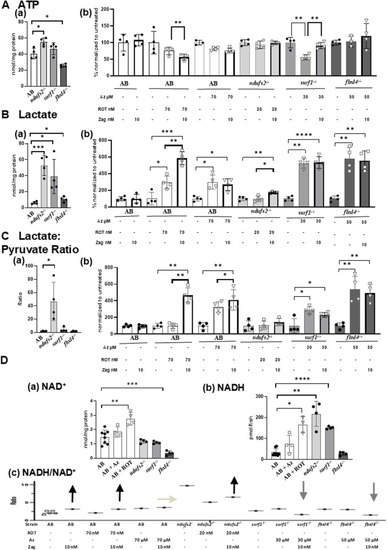
Effects of zag treatment on ATP, lactate, lactate/pyruvate, and NADH/NAD levels in pharmacological and genetic models of complex I and complex IV deficiency. (A)(a) Basal ATP contents at 7 dpf in genetic models: AB (white), ndufs2−/− (light gray), surf1−/− (gray), and fbxl4−/− (dark gray). (B) Change of ATP levels after stressor (ROT or azide) with or without zag (10 nM) treatment compared to that in non-treated animals. Graphs indicate mean and standard deviation of n = 4 biological replicates. Student’s t-test, *p < 0.05, and **p < 0.01. (B)(a) Basal lactate contents at 7 dpf in genetic models: AB (white), ndufs2−/− (light gray), surf1−/− (gray), and fbxl4−/− (dark gray). (B) Change of lactate levels after stressor (ROT or azide) with or without zag (10 nM) treatment compared to that in non-treated animals. Graphs indicate mean and standard deviation of n = 4 biological replicates. Student’s t-test, *p < 0.05, *p < 0.01, ***p < 0.001, and ****p < 0.0001. (C)(a) Basal lactate to pyruvate ratio at 7 dpf in genetic models: AB (white), ndufs2−/− (light gray), surf1−/− (gray), and fbxl4−/− (dark gray). (B) Change of lactate-to-pyruvate ratio after stressor (ROT or Az) with or without zag (10 nM) treatment compared to that in non-treated animals. Graphs indicate mean and standard deviation of n = 4 biological replicates. Student’s t-test, *p < 0.05, and **p < 0.01. (D)(a) NAD contents at 7 dpf in pharmacological and genetic models: AB (solid circle), AB+ ROT (70 nM) (square), AB+ azide (70 μM) (triangle), ndufs2−/− (light gray), surf1−/− (gray), and fbxl4−/− (dark gray). (B) NADH contents at 7 dpf in pharmacological and genetic models: AB (solid circle), AB+ ROT (70 nM) (square), AB+ azide (70 μM) (triangle), ndufs2−/− (light gray), surf1−/− (gray), and fbxl4−/− (dark gray). NADH levels were normalized by fish numbers. (C) NADH to NAD+ ratio (NADH/NAD+) at 7 dpf in pharmacological and genetic models after stressor (ROT or azide) with or without zag (10 nM) treatment. Representative NADH/NAD+ ratios were calculated using average data for NAD+ and NADH contents normalized by fish numbers for each condition (n = 4 biological replicates) due to the difficulty of obtaining NAD+ and NADH measurements from the same homogenate. For non-treated AB, five different sets of NAD+ and NADH averaged from n = 4 biological replicates for each set were shown, assuring that the variation is very low. Arrows indicate the direction of zag effects on the NADH/NAD+ ratio. (A)(b), (B)(b), and (C)(b): unstressed (black circle), zag treated (bold outline), ROT (square), and azide (triangle).
|
