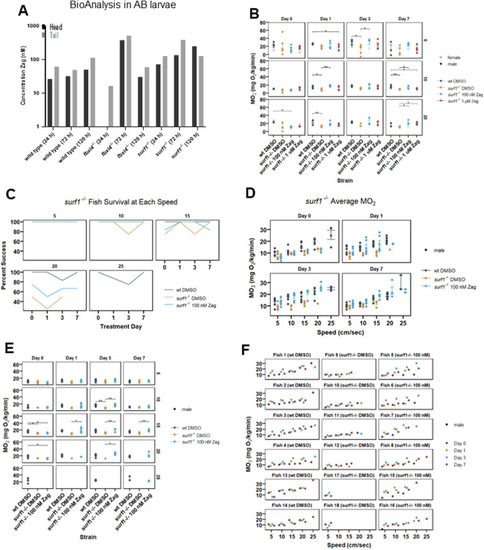
Zag accumulates in adult zebrafish brain and tail muscle while affecting adult swim capacity and oxygen consumption rate in surf1−/− but not fbxl4−/− adult fish. (A) BioAnalysis of adult zebrafish brain and tail muscle tissues confirms that zag enters the zebrafish muscle and brain after incubation in the water for 24–72 h. There is a trend toward increasing concentrations in both tissues with time. At 24 h, in the fbxl4−/− mutant, the level was below the detection limit. n = 1 animal at each timepoint. (B) Individual adult zebrafish are introduced into the swim tunnel designed to have a constant current across the cross-sectional area that can be remotely controlled. The zebrafish instinctively swim against the current until fatigued. In this experiment, the current speed was incrementally increased between 0 and 20 cm/s, as shown. (C) At 5 cm/s, 100% of zebrafish successfully completed the swim, and the data appear as a single line. In surf1−/− mutants, the ability to swim at 15 cm/s and higher currents diminished compared to that in WT. (D–F) Six months post fertilization fish were used in the second replicate with additional current speeds. While actively swimming, the tunnel can be closed to air, and oxygen depletion can be measured. The MO2 is plotted for individual fish as a function of current. The points are colored to distinguish mutation and treatment, as shown in the legend, and the shape distinguishes sex. (D) Each of the four subpanels identifies the days of zag treatment. (E) Each panel is separated by length of treatment (days) and swim speed (cm/s). The x-axis is MO2, and the y-axis is the treatment group for each panel. (F) Each panel is separated by an individual fish, with treatments listed in parentheses. The x-axis is water speed (cm/s), and the y-axis is MO2 for each panel. The colored dots (see legend) denote the different days that each fish was swum.
|
