
- Title
-
Novel anti-VEGF scFv antibodies with superior in vitro and in vivo activities
- Authors
- Cakan-Akdogan, G., Erez, O., Ozer, C., Onal, E., Mert, O., Gullu, S., Arslan, M., Avci, M.E., Inan, M., Kalyoncu, S.
- Source
- Full text @ Sci. Rep.
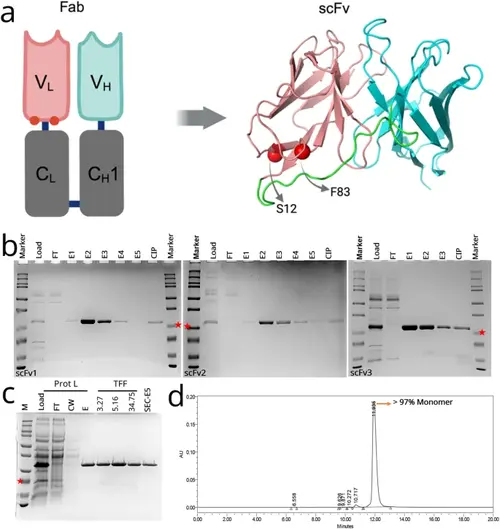
Structure, production, and purification of anti-VEGF scFv variants. (A) Graphic representing the location of mutated residues (red spheres) in the original ranibizumab template, and the modelled structure of the scFv variant. Positions for selected mutations of F83E and S12M are represented by red spheres. Variable heavy chain (VH), light chain (VL) and linker are colored cyan, salmon and green, respectively. (B) Protein L-purified proteins were analyzed on SDS-PAGE gel for scFv1 (left), scFv2 (middle), scFv3 (right). FT: flow-through, E1-E5: Elution fractions, CIP: Clean-in-place (proteins stuck onto the Protein L column). scFv bands at around 25 kDa (indicated with red stars). (C) Samples from Protein L purification and protein concentration steps are analyzed on SDS-PAGE. Prot L: Protein L Chromatography, TFF: Tangential Flow Filtration, FT: Flow-Through, CW: Column Wash, E: Elution, SEC: Size Exclusion Chromatography. (D) Representative SEC-HPLC chromatogram of the purified scFv1. Detection at 280 nm absorbance (mAU) and conductivity (mS/cm) was plotted. Monomer peak was observed at 12 min. |
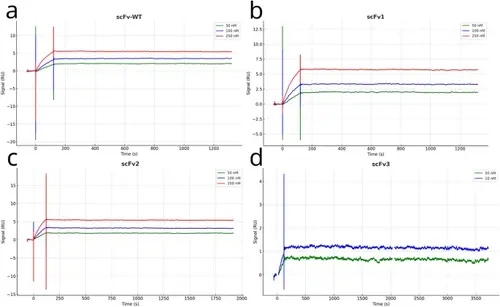
SPR binding kinetics and melting temperatures of the anti-VEGF scFvs. SPR sensorgrams along with used antibody concentrations of (A) scFWT, (B) scFv1, (C) scFv2, (D) scFv3. |
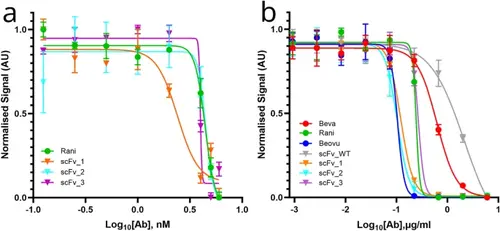
Inhibitory activity of the scFv variants. A) Inhibition of VEGF induced HUVEC proliferation was tested with an MTT assay. Three variants were compared to the reference ranibizumab. B) VEGF induced VEGFR2 activity test with a VEGF bioassay kit was analyzed with normalized luminescence values for 9 different concentrations of anti-VEGFs. scFv1/2/3 variants and scFvWT were compared to bevacizumab, ranibizumab, brolucizumab. Bevacizumab (red), ranibizumab (green), brolucizumab (navy), scFvWT (gray), scFv1 (orange), scFv2 (blue), scFv3 (purple). IC50 was calculated after 4PL fitting of log(molarity) vs. the absorbance values, using GraphPad Prism (version 8.0.1, GraphPad Software, Boston, Massachusetts USA). |
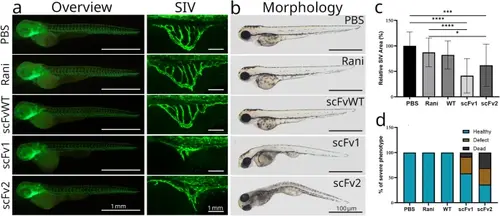
In vivo angiogenesis inhibition tests. Anti-VEGFs were injected into the yolk of 2 dpf embryos, prior to the onset of SIV angiogenesis and embryos were imaged with stereomicroscope at 3 dpf. (A) Overview images of the transgenic fish showing vasculature (left), representative close-up images of SIV recorded at the confocal microscope (right). (B) Representative images showing the morphologies of injected embryos at 3 dpf. Whole body images were acquired with brightfield (right) and fluorescent stereomicroscope (left) and SIV images were acquired with confocal microscope (middle). Statistical significance was tested with one-tail T-test with a confidence interval of 95%, with Excel software (Microsoft, Redmond, WA, USA). Error bars represent SD. ns: non-significant, * P ≤ 0.05, ** P ≤ 0.01, *** P ≤ 0.001, **** P ≤ 0.0001. (C) Plot of average SIV area of each group is presented. SIV area was measured in 24 embryos (normal or defective morphology) in each experimental group. Two independent experiments were conducted with similar results. (D) Plot showing ratio of healthy (blue), defective (orange) or dead (black) embryos injected with antibodies or PBS. Sample size (n) = 40 (PBS), 38 (ranibizumab), 37 (scFvWT), 36 (scFv1), 39 (scFv2) 39. Two independent experiments were conducted with similar results. |
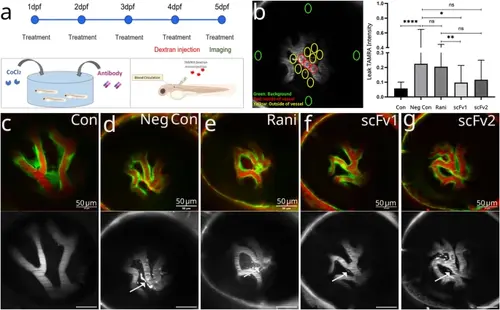
Inhibition of retinal leakage. (A) Graphic representation of the experimental design. Zebrafish embryos were kept in embryo medium containing CoCl2 and antibodies to be tested from 1–5 dpf. TAMRA dextran was injected to the vasculature at 4 dpf larvae and retinal vessels were imaged at 5 dpf. (B) Dye intensity was measured in every retina, in different comparable positions. The number of ROIs and locations are indicated on the image with circles. Larval background signal (green circles), signal in the vein (red circles) and signal around the vessels (yellow circles). Plot shows normalized average leak intensity in each group (n = 5) larvae per group, 2 independent experiments were conducted, similar results were obtained. Results of one experiment is displayed. Statistical significance was tested by one-way ANOVA followed by Kruskal-Wallis comparison test. Error bars represent ± SD ns: non-significant, * P ≤ 0.05, ** P ≤ 0.01, *** P ≤ 0.001, **** P ≤ 0.0001. C - G) Representative images from each experimental group. Overlay image (first row), TAMRA image (second row) is shown for each condition. (C) Control larva that was maintained in normal embryo medium, (D) negative control larva that was treated with CoCl2 but did not receive any anti-VEGF, (E) ranibizumab treated, (F) scFv1 treated and (G) scFv2 treated larva. |
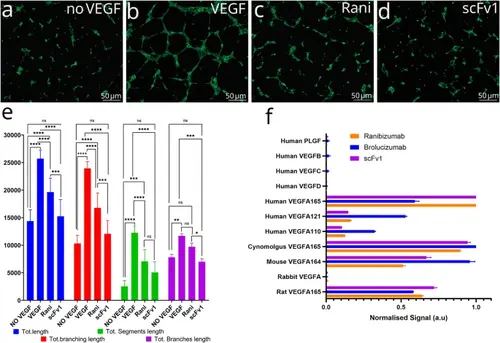
Lead variant potently inhibits HUVEC angiogenesis. A-D) Representative images of HUVECs after treatments. (A) HUVECs do not form tubular network in absence of VEGFA, (B) 1 nM VEGFA induces formation of a HUVEC tubular network. Addition of 2 nM (C) ranibizumab or (D) scFv1 inhibits tubular network formation. (E) Plot of angiogenesis parameters. scFv1 inhibits tubular network formation more efficiently than ranibizumab. Total length, total branching length, total segment length and total branch length were calculated by 2-way ANOVA followed by Dunett’s multiple comparison test, error bars represent SD. ns: non-significant, * P ≤ 0.05, ** P ≤ 0.01, *** P ≤ 0.001, **** P ≤ 0.0001. (F) Bar graph showing binding affinities of ranibizumab, brolucizumab and scFv1 to human VEGFs, VEGF isoforms and VEGFA orthologs in model organisms. |