
|
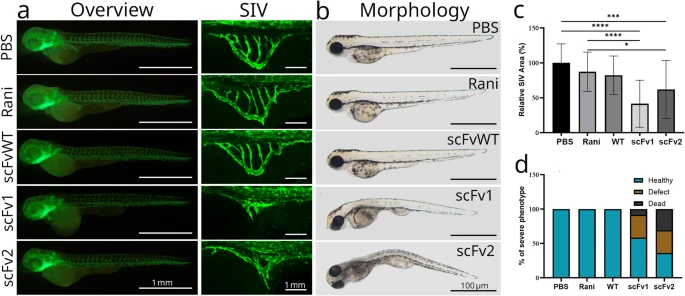
Fig. 4 In vivo angiogenesis inhibition tests. Anti-VEGFs were injected into the yolk of 2 dpf embryos, prior to the onset of SIV angiogenesis and embryos were imaged with stereomicroscope at 3 dpf. (A) Overview images of the transgenic fish showing vasculature (left), representative close-up images of SIV recorded at the confocal microscope (right). (B) Representative images showing the morphologies of injected embryos at 3 dpf. Whole body images were acquired with brightfield (right) and fluorescent stereomicroscope (left) and SIV images were acquired with confocal microscope (middle). Statistical significance was tested with one-tail T-test with a confidence interval of 95%, with Excel software (Microsoft, Redmond, WA, USA). Error bars represent SD. ns: non-significant, * P ≤ 0.05, ** P ≤ 0.01, *** P ≤ 0.001, **** P ≤ 0.0001. (C) Plot of average SIV area of each group is presented. SIV area was measured in 24 embryos (normal or defective morphology) in each experimental group. Two independent experiments were conducted with similar results. (D) Plot showing ratio of healthy (blue), defective (orange) or dead (black) embryos injected with antibodies or PBS. Sample size (n) = 40 (PBS), 38 (ranibizumab), 37 (scFvWT), 36 (scFv1), 39 (scFv2) 39. Two independent experiments were conducted with similar results.