FIGURE SUMMARY
Title

Salidroside inhibits melanin synthesis and melanoma growth via mTOR and PI3K/Akt pathways

Authors
Ouyang, Q., Tian, S., Zhou, H., Mao, Y., Li, X., Yan, F., Liu, A., Hu, X., You, C., He, J.
Source
Full text @ Front Oncol

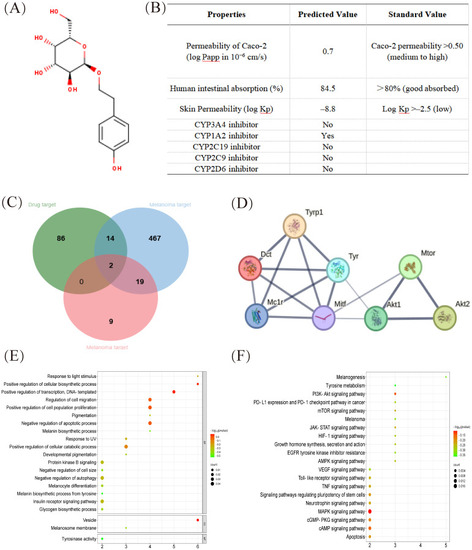
In silico SwissADME profile and protein target of salidroside. (A) Chemical structure of salidroside. (B) Pharmacokinetic properties of salidroside calculated with the SwissADME database. (C) The Venn map related to overlapping genes from bioactive compounds in salidroside and melanoma-related genes. (D) The cluster analysis of the central eight targets. The central eight targets were identified as core targets based on degree values. (E) GO enrichment analysis (Biological process, molecular function and cellular component enrichment analysis). (F) KEGG pathway enrichment analysis. GO, Gene Ontology; KEGG, Kyoto Encyclopedia of Genes and Genomes.

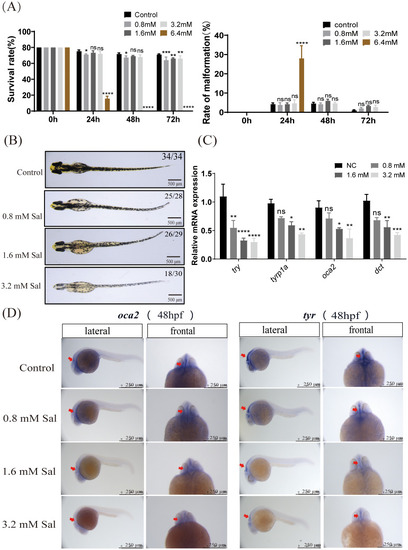
Salidroside affected melanin in early zebrafish embryos. (A) Survival rate of embryos within 72-h salidroside-treated zebrafish embryos and morphological deformity rates (including pericardial oedema, spine curvature, and tail abnormality) in salidroside-treated (0–72 hpf) zebrafish embryos (n = 80 for each group). (B) Representative images of zebrafish embryos after 48 h of salidroside exposure at different concentrations (0, 0.8,1.6 and 3.2 mM). Scale bar, 500 μm. (C) Effects of salidroside on mRNA expression levels of genes related to melanin synthesis in early zebrafish embryos. ns, no significance, *p < 0.05, **p < 0.01, ***p < 0.005, ****p < 0.001 compared with the control. Results were denoted as mean ± SD of three independent experiments. (D) Expression patterns of oca2 and tyr by whole-mount in situ hybridization in two-day-old zebrafish embryos. Scale bars, 250 μm. SD, standard deviation.

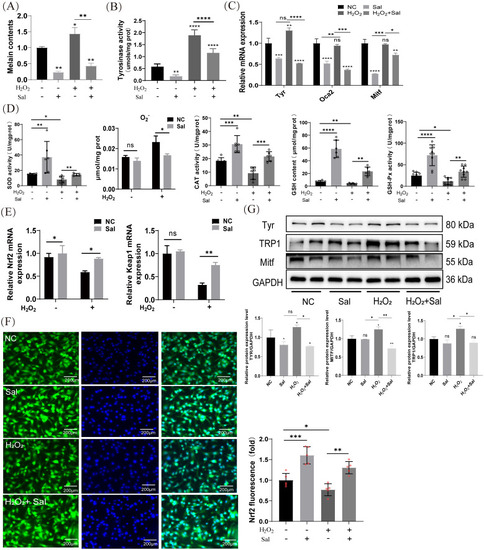
Salidroside inhibits H2O2-induced melanogenesis by promoting antioxidant effect in B16F10 cells. (A) Salidroside treatment for 24 h reduced melanin synthesis after H2O2 induction. *p < 0.05, **p < 0.01, n=3 (B) Cellular tyrosinase activity and tyrosinase activity levels were measured by dopachrome formation from L-DOPA as a substrate. (C) The mRNA expression levels of Tyr, Mitf and Oca2 in B16F10 cells were measured by RT-qPCR. ns, no significance, *p < 0.05, **p < 0.01, *** p < 0.005, ****p < 0.001, n=3. (D) B16F10 cells were treated with salidroside for 24 h or H2O2 for 4 h and cell homogenates were obtained using an ultrasonic crusher. The levels of SOD, O2•− content, CAT, GSH and GSH-px in the cells were measured by the corresponding kits. All data are expressed as mean ± SD (n = 6/9). ns, no significance, *p < 0.05, **p < 0.01, ***p < 0.005, ****p < 0.001. (E) The mRNA expression levels of Nrf2 and Keap1 in B16F10 cells were determined by RT-qPCR. ns, no significance, *p < 0.05, **p < 0.01. (F) Immunofluorescence staining results of Nrf2 in B16F10 cells (n=4), scale bar=200 μm. **p < 0.01, ***p < 0.005. (G) The protein-expression levels of Tyr, TRP-1, and Mitf were examined by western blotting analysis and greyscale analysis of proteins. GAPDH functioned as a loading control. NC, untreated control; Sal, salidroside; H2O2 + salidroside, After H2O2 induction for 4 h ns, no significance, *p < 0.05, **p < 0.01. Results were denoted as mean ± SD of three times. L-DOPA, l-3,4-dihydroxyphenylalanine; SOD, superoxide dismutase; O2•−, superoxide anion; CAT, catalase; GSH, glutathione; GSH-Px, Glutathione peroxidase; RT-qPCR, quantitative reverse transcription polymerase chain reaction; GAPDH, glyceraldehyde 3-phosphate dehydrogenase; SD, standard deviation.

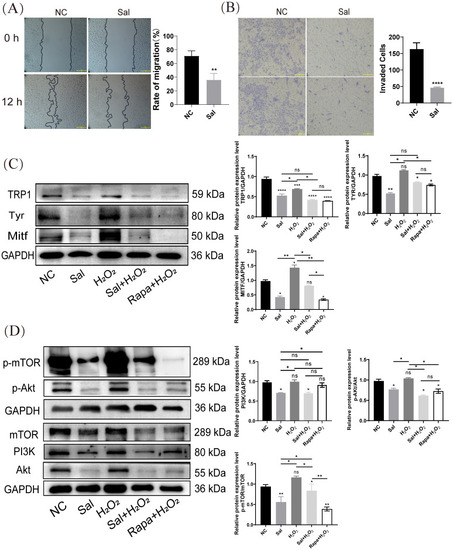
Salidroside inhibits H2O2-inductd melanogenesis by inactivating PI3K/AKT/mTOR. (A) Wounding-healing assays conducted in B16F10 cells. Cells were treated with salidroside (Sal) in serum-free 1640 medium. The wounds were photographed at 0 and 12 h after salidroside treatment. Representative photos from each group are presented in the left panels, migration rates are shown in the right panels. Data are shown as mean ± SD of three independent experiments, **p < 0.01, n = 3, scale bar = 100 μm. (B) After 24 h of salidroside treatment, B16F10 cells was detected by Trans-well assay. ****p < 0.001, n = 3, scale bar = 100 μm. (C) The protein-expression levels of melanin synthesis-related proteins (TRP1, Tyr and Mitf) in B16F10 cells were detected by western blotting. (D) The protein-expression levels of PI3K/Akt/mTOR signaling pathway-related proteins (PI3K, Akt, and mTOR) in B16F10 cells were detected by western blotting. GAPDH functioned as a loading control. NC: untreated control; Sal: salidroside; H2O2 + salidroside: After H2O2 induction for 4 h, incubation with salidroside (100 μM) was performed for 24 h; H2O2 + Rapa: After H2O2 induction for 4 h, incubation with rapamycin (2 μM) was performed for 24 (h) ns, no significance, *p < 0.05, **p < 0.01, vs. control group. Results are denoted as mean ± SD. GAPDH, glyceraldehyde 3-phosphate dehydrogenase; SD, standard deviation.

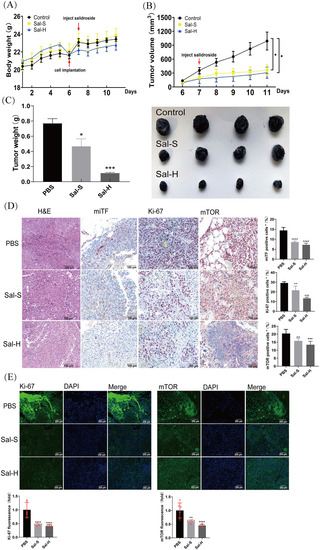
Salidroside suppresses tumor growth in syngeneic tumor model. (A) Body weight of mice during the treatment period. (B) Tumor volume of mice during the treatment period. *p < 0.05. (C) Tumor weight (left panel) and representative photos of tumor dissected from mice (right panel). *p < 0.05, ***p < 0.005, vs. control group. n=4. Sal-S: salidroside 4 mg/kg. Sal-H: salidroside 8 mg/kg. (D) HE and IHC staining of Ki-67, miTF, and mTOR in tumor tissues. Representative melanoma sections from mice of each group are presented in the left panels. Relative positive rates are shown in the right panels. Data are presented as mean ± SD of four mice. **p < 0.01, ***p < 0.005, ****p < 0.001. vs. control group, scale bar = 100 μm. (E) The expression of Ki-67 and mTOR were detected by IHC assay in the tumor issues of mice (n=4). Data were presented as the mean ± SD, scale bar = 200 μm, **p < 0.01, ****p < 0.001. HE, hematoxylin and eosin; IHC, immunohistochemistry; SD, standard deviation.

Acknowledgments
This image is the copyrighted work of the attributed author or publisher, and ZFIN has permission only to display this image to its users. Additional permissions should be obtained from the applicable author or publisher of the image. Full text @ Front Oncol