
- Title
-
Identification and Functional Characterization of a Novel PRPS1 Variant in X-Linked Nonsyndromic Hearing Loss: Insights From Zebrafish and Cellular Models
- Authors
- Wan, Y., Li, J., Guo, Y., Guo, F., Zhao, Y., Li, Y., Yang, X., Chen, H., Xie, S., Wang, M., Guan, G., Zhu, Y., Li, X.
- Source
- Full text @ Hum. Mutat.
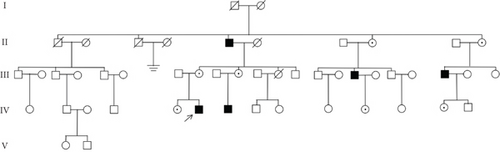
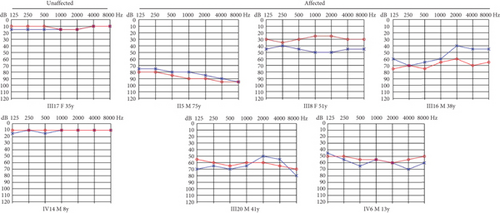
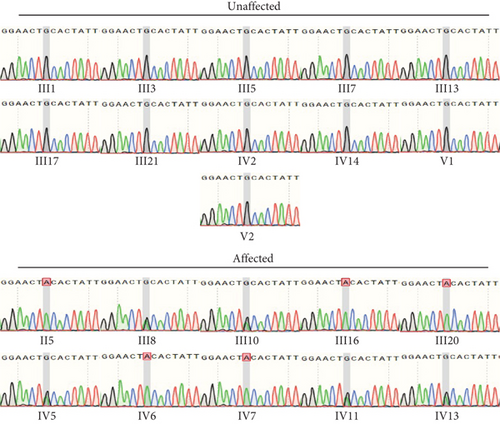
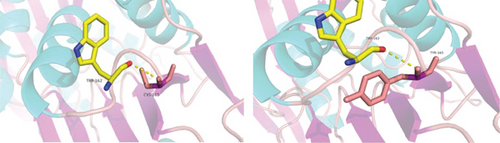
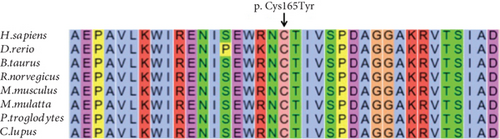
Identification of a novel PRPS1 variant in human hearing loss. (a) Pedigree of a five-generation Chinese family with X-linked HL. Affected males are represented by filled squares, and affected females are represented by circles with center dots. Unaffected individuals are represented by open squares (males) and circles (females). The proband is indicated with a black arrow. Slant lines mark deceased individuals. (b) Audiograms of selected family members, showing air conduction thresholds. Blue “X” denotes the left ear, and red “O” denotes the right ear. (c) Sanger sequencing data from 21 participants showing the normal, hemizygous, and heterozygous PRPS1 variant carriers. (d) Crystal structure of human PRS-I (PDB: 2H06) and the predicted structure with the p.Cys165Tyr variant. (e) Conservation analysis of the cysteine residue at position 165 across species, estimated by T-Coffee. |
Identification of a novel PRPS1 variant in human hearing loss. (a) Pedigree of a five-generation Chinese family with X-linked HL. Affected males are represented by filled squares, and affected females are represented by circles with center dots. Unaffected individuals are represented by open squares (males) and circles (females). The proband is indicated with a black arrow. Slant lines mark deceased individuals. (b) Audiograms of selected family members, showing air conduction thresholds. Blue “X” denotes the left ear, and red “O” denotes the right ear. (c) Sanger sequencing data from 21 participants showing the normal, hemizygous, and heterozygous PRPS1 variant carriers. (d) Crystal structure of human PRS-I (PDB: 2H06) and the predicted structure with the p.Cys165Tyr variant. (e) Conservation analysis of the cysteine residue at position 165 across species, estimated by T-Coffee. |
Identification of a novel PRPS1 variant in human hearing loss. (a) Pedigree of a five-generation Chinese family with X-linked HL. Affected males are represented by filled squares, and affected females are represented by circles with center dots. Unaffected individuals are represented by open squares (males) and circles (females). The proband is indicated with a black arrow. Slant lines mark deceased individuals. (b) Audiograms of selected family members, showing air conduction thresholds. Blue “X” denotes the left ear, and red “O” denotes the right ear. (c) Sanger sequencing data from 21 participants showing the normal, hemizygous, and heterozygous PRPS1 variant carriers. (d) Crystal structure of human PRS-I (PDB: 2H06) and the predicted structure with the p.Cys165Tyr variant. (e) Conservation analysis of the cysteine residue at position 165 across species, estimated by T-Coffee. |
Identification of a novel PRPS1 variant in human hearing loss. (a) Pedigree of a five-generation Chinese family with X-linked HL. Affected males are represented by filled squares, and affected females are represented by circles with center dots. Unaffected individuals are represented by open squares (males) and circles (females). The proband is indicated with a black arrow. Slant lines mark deceased individuals. (b) Audiograms of selected family members, showing air conduction thresholds. Blue “X” denotes the left ear, and red “O” denotes the right ear. (c) Sanger sequencing data from 21 participants showing the normal, hemizygous, and heterozygous PRPS1 variant carriers. (d) Crystal structure of human PRS-I (PDB: 2H06) and the predicted structure with the p.Cys165Tyr variant. (e) Conservation analysis of the cysteine residue at position 165 across species, estimated by T-Coffee. |
Identification of a novel PRPS1 variant in human hearing loss. (a) Pedigree of a five-generation Chinese family with X-linked HL. Affected males are represented by filled squares, and affected females are represented by circles with center dots. Unaffected individuals are represented by open squares (males) and circles (females). The proband is indicated with a black arrow. Slant lines mark deceased individuals. (b) Audiograms of selected family members, showing air conduction thresholds. Blue “X” denotes the left ear, and red “O” denotes the right ear. (c) Sanger sequencing data from 21 participants showing the normal, hemizygous, and heterozygous PRPS1 variant carriers. (d) Crystal structure of human PRS-I (PDB: 2H06) and the predicted structure with the p.Cys165Tyr variant. (e) Conservation analysis of the cysteine residue at position 165 across species, estimated by T-Coffee. |
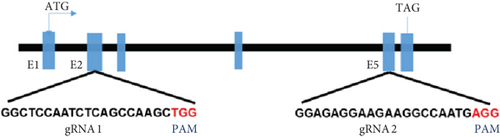
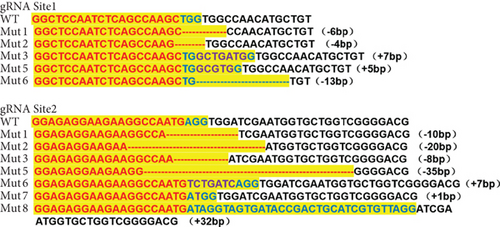
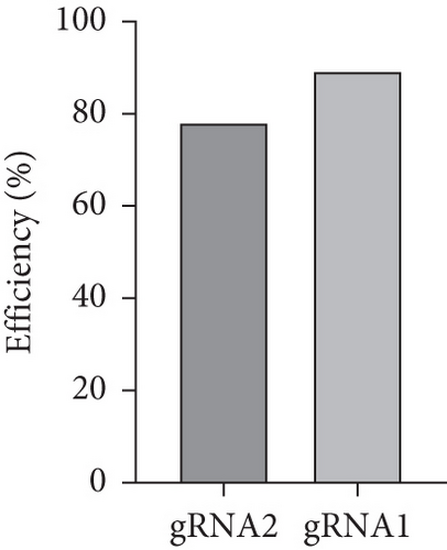
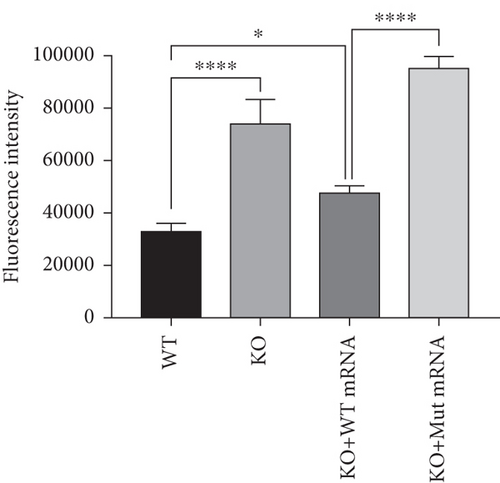
Characterization of prps1a gene editing and phenotypic analysis in zebrafish. (a) Schematic of the zebrafish prps1a gene structure, highlighting the gRNA target sites. Arrows indicate gRNA binding sites, with exons represented as boxes. (b) Sequencing analysis of mutations induced by the two gRNAs showing various mutation types, including insertions, deletions, and substitutions. (c) Validation of gRNA activity through cleavage assays, assessing the efficiency of double-strand break induction by each gRNA. (d) Hair cell staining in zebrafish larvae across four experimental groups: wild-type (WT), gene KO, KO with wild-type mRNA injection (KO+WT mRNA), and WT with Cys165Tyr mutant mRNA injection (WT+Cys165Tyr). Scale bar = 200 μm. (e) Confocal microscopy images of hair cells in zebrafish larvae from different experimental groups showing structural integrity and localization. Scale bar = 20 μm. (f) Quantification of hair cells in different experimental groups. (g) Behavioral tracking of zebrafish larvae, recording movement patterns to assess the impact of prps1a gene editing on behavior. (h) Line graph of swimming distance of zebrafish with different genotypes under noise. (i) Statistical analysis of behavioral data of total distance. (j) Statistical analysis of behavioral data of first distance. (k) Representative microscopic images of hair cells stained with AO in zebrafish larvae from different experimental groups. Scale bar = 100 μm. (l) Quantification of fluorescence intensity in hair cells of the larvae. Data were compared using ANOVA followed by post hoc tests, with significant differences indicated (p < 0.05). Data are presented as mean ± SD. ∗p < 0.05, ∗∗p < 0.01, ∗∗∗p < 0.001, and ∗∗∗∗p < 0.0001. |
Characterization of prps1a gene editing and phenotypic analysis in zebrafish. (a) Schematic of the zebrafish prps1a gene structure, highlighting the gRNA target sites. Arrows indicate gRNA binding sites, with exons represented as boxes. (b) Sequencing analysis of mutations induced by the two gRNAs showing various mutation types, including insertions, deletions, and substitutions. (c) Validation of gRNA activity through cleavage assays, assessing the efficiency of double-strand break induction by each gRNA. (d) Hair cell staining in zebrafish larvae across four experimental groups: wild-type (WT), gene KO, KO with wild-type mRNA injection (KO+WT mRNA), and WT with Cys165Tyr mutant mRNA injection (WT+Cys165Tyr). Scale bar = 200 μm. (e) Confocal microscopy images of hair cells in zebrafish larvae from different experimental groups showing structural integrity and localization. Scale bar = 20 μm. (f) Quantification of hair cells in different experimental groups. (g) Behavioral tracking of zebrafish larvae, recording movement patterns to assess the impact of prps1a gene editing on behavior. (h) Line graph of swimming distance of zebrafish with different genotypes under noise. (i) Statistical analysis of behavioral data of total distance. (j) Statistical analysis of behavioral data of first distance. (k) Representative microscopic images of hair cells stained with AO in zebrafish larvae from different experimental groups. Scale bar = 100 μm. (l) Quantification of fluorescence intensity in hair cells of the larvae. Data were compared using ANOVA followed by post hoc tests, with significant differences indicated (p < 0.05). Data are presented as mean ± SD. ∗p < 0.05, ∗∗p < 0.01, ∗∗∗p < 0.001, and ∗∗∗∗p < 0.0001. |
Characterization of prps1a gene editing and phenotypic analysis in zebrafish. (a) Schematic of the zebrafish prps1a gene structure, highlighting the gRNA target sites. Arrows indicate gRNA binding sites, with exons represented as boxes. (b) Sequencing analysis of mutations induced by the two gRNAs showing various mutation types, including insertions, deletions, and substitutions. (c) Validation of gRNA activity through cleavage assays, assessing the efficiency of double-strand break induction by each gRNA. (d) Hair cell staining in zebrafish larvae across four experimental groups: wild-type (WT), gene KO, KO with wild-type mRNA injection (KO+WT mRNA), and WT with Cys165Tyr mutant mRNA injection (WT+Cys165Tyr). Scale bar = 200 μm. (e) Confocal microscopy images of hair cells in zebrafish larvae from different experimental groups showing structural integrity and localization. Scale bar = 20 μm. (f) Quantification of hair cells in different experimental groups. (g) Behavioral tracking of zebrafish larvae, recording movement patterns to assess the impact of prps1a gene editing on behavior. (h) Line graph of swimming distance of zebrafish with different genotypes under noise. (i) Statistical analysis of behavioral data of total distance. (j) Statistical analysis of behavioral data of first distance. (k) Representative microscopic images of hair cells stained with AO in zebrafish larvae from different experimental groups. Scale bar = 100 μm. (l) Quantification of fluorescence intensity in hair cells of the larvae. Data were compared using ANOVA followed by post hoc tests, with significant differences indicated (p < 0.05). Data are presented as mean ± SD. ∗p < 0.05, ∗∗p < 0.01, ∗∗∗p < 0.001, and ∗∗∗∗p < 0.0001. |
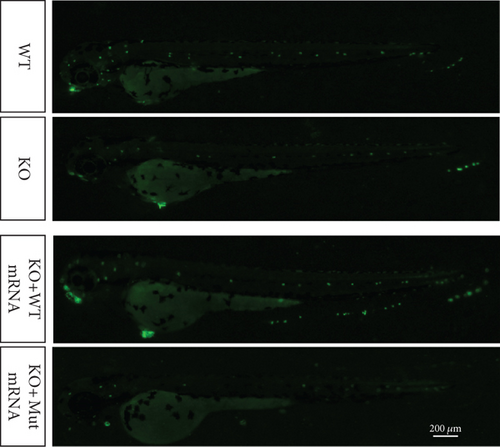
Characterization of prps1a gene editing and phenotypic analysis in zebrafish. (a) Schematic of the zebrafish prps1a gene structure, highlighting the gRNA target sites. Arrows indicate gRNA binding sites, with exons represented as boxes. (b) Sequencing analysis of mutations induced by the two gRNAs showing various mutation types, including insertions, deletions, and substitutions. (c) Validation of gRNA activity through cleavage assays, assessing the efficiency of double-strand break induction by each gRNA. (d) Hair cell staining in zebrafish larvae across four experimental groups: wild-type (WT), gene KO, KO with wild-type mRNA injection (KO+WT mRNA), and WT with Cys165Tyr mutant mRNA injection (WT+Cys165Tyr). Scale bar = 200 μm. (e) Confocal microscopy images of hair cells in zebrafish larvae from different experimental groups showing structural integrity and localization. Scale bar = 20 μm. (f) Quantification of hair cells in different experimental groups. (g) Behavioral tracking of zebrafish larvae, recording movement patterns to assess the impact of prps1a gene editing on behavior. (h) Line graph of swimming distance of zebrafish with different genotypes under noise. (i) Statistical analysis of behavioral data of total distance. (j) Statistical analysis of behavioral data of first distance. (k) Representative microscopic images of hair cells stained with AO in zebrafish larvae from different experimental groups. Scale bar = 100 μm. (l) Quantification of fluorescence intensity in hair cells of the larvae. Data were compared using ANOVA followed by post hoc tests, with significant differences indicated (p < 0.05). Data are presented as mean ± SD. ∗p < 0.05, ∗∗p < 0.01, ∗∗∗p < 0.001, and ∗∗∗∗p < 0.0001. PHENOTYPE:
|
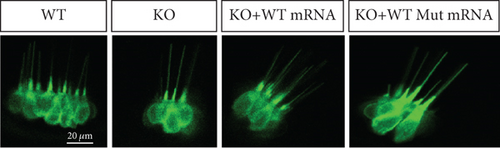
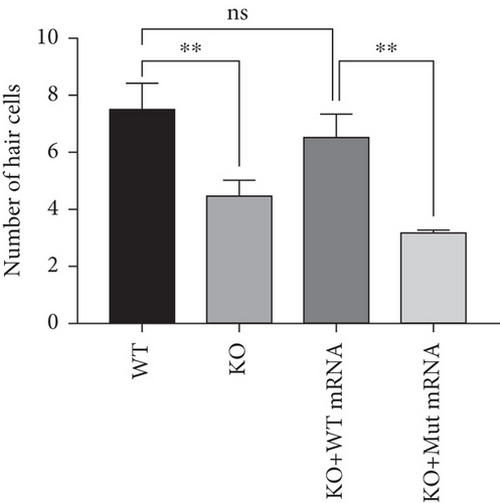
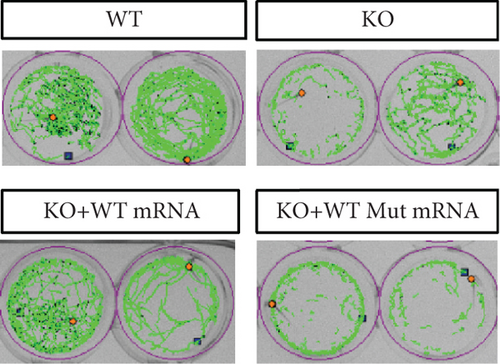
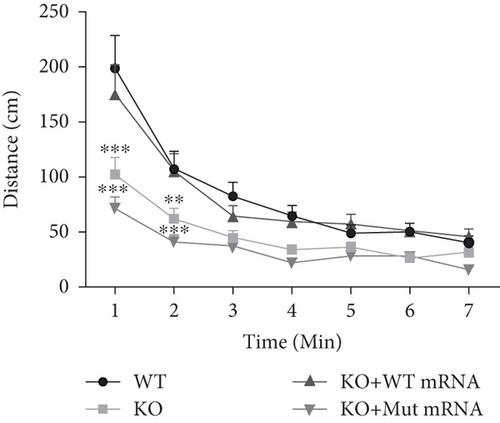
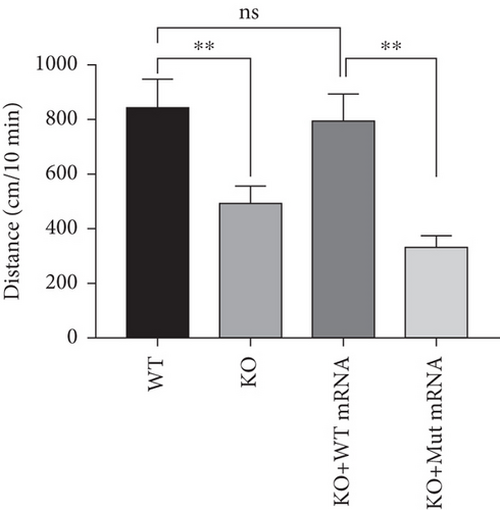
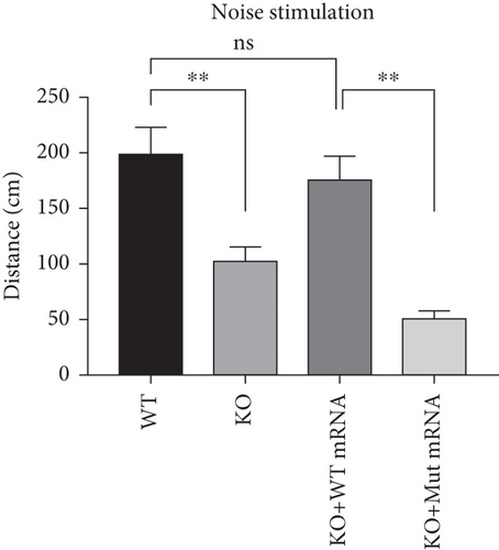
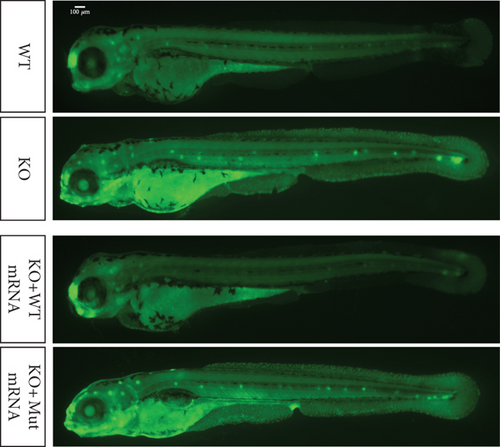
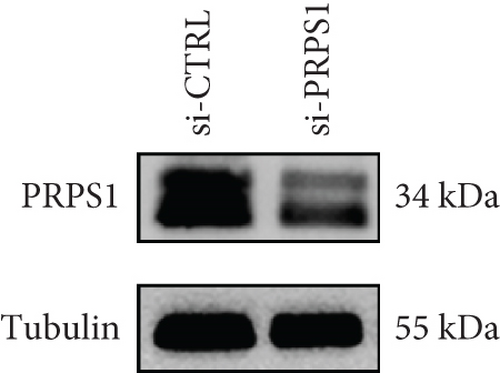
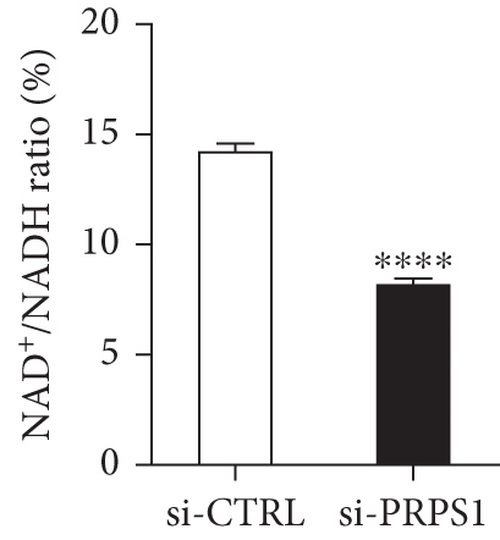
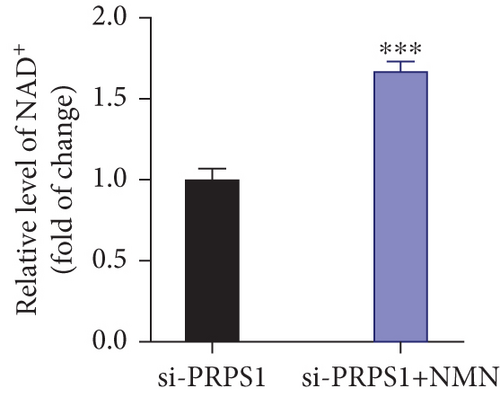
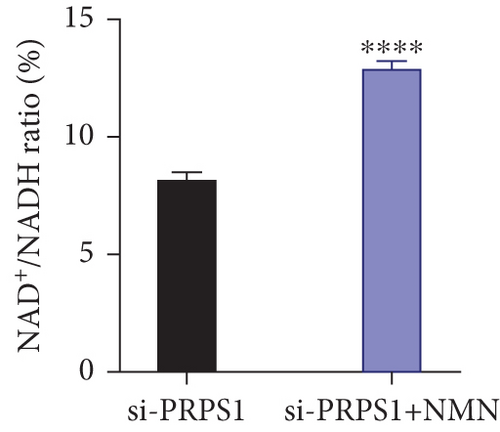
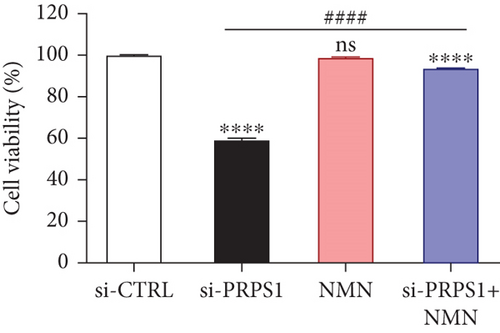
PRPS1 knockdown reduces NAD+ levels, NAD+/NADH ratio, and cell viability in HEI-OC1 cells. (a) Western blot analysis of PRPS1 expression after transfection with PRPS1-siRNA or negative-siRNA, with tubulin as the internal control. (b) Quantification of PRPS1 expression levels from (a). Measurement of intracellular (c) NAD+ levels and (d) NAD+/NADH ratio in si-CTRL and si-PRPS1 groups. Measurement of intracellular (e) NAD+ levels and (f) NAD+/NADH ratio in si-PRPS1 and si-PRPS1+NMN groups. (g) Cell viability assessed by CCK-8 assay. Data are presented as three independent experiments’ mean ± SD. ∗∗∗p < 0.001 and ∗∗∗∗p < 0.0001 compared with the si-CTRL; ####p < 0.0001 compared with the si-PRPS1. |
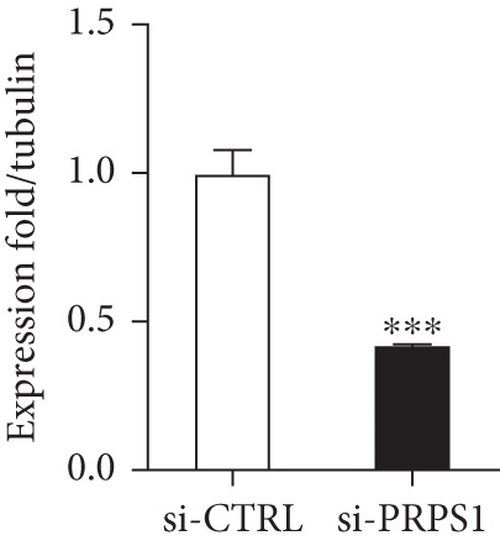
PRPS1 knockdown reduces NAD+ levels, NAD+/NADH ratio, and cell viability in HEI-OC1 cells. (a) Western blot analysis of PRPS1 expression after transfection with PRPS1-siRNA or negative-siRNA, with tubulin as the internal control. (b) Quantification of PRPS1 expression levels from (a). Measurement of intracellular (c) NAD+ levels and (d) NAD+/NADH ratio in si-CTRL and si-PRPS1 groups. Measurement of intracellular (e) NAD+ levels and (f) NAD+/NADH ratio in si-PRPS1 and si-PRPS1+NMN groups. (g) Cell viability assessed by CCK-8 assay. Data are presented as three independent experiments’ mean ± SD. ∗∗∗p < 0.001 and ∗∗∗∗p < 0.0001 compared with the si-CTRL; ####p < 0.0001 compared with the si-PRPS1 |
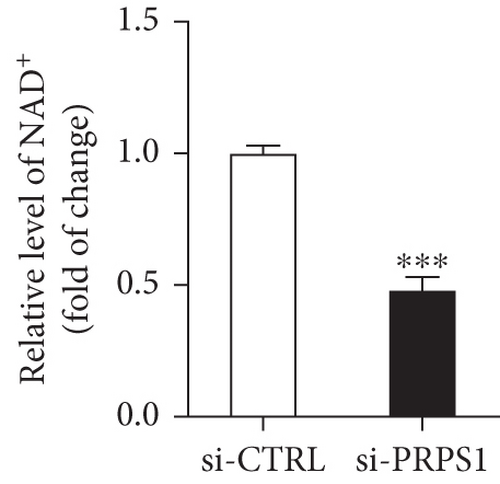
PRPS1 knockdown reduces NAD+ levels, NAD+/NADH ratio, and cell viability in HEI-OC1 cells. (a) Western blot analysis of PRPS1 expression after transfection with PRPS1-siRNA or negative-siRNA, with tubulin as the internal control. (b) Quantification of PRPS1 expression levels from (a). Measurement of intracellular (c) NAD+ levels and (d) NAD+/NADH ratio in si-CTRL and si-PRPS1 groups. Measurement of intracellular (e) NAD+ levels and (f) NAD+/NADH ratio in si-PRPS1 and si-PRPS1+NMN groups. (g) Cell viability assessed by CCK-8 assay. Data are presented as three independent experiments’ mean ± SD. ∗∗∗p < 0.001 and ∗∗∗∗p < 0.0001 compared with the si-CTRL; ####p < 0.0001 compared with the si-PRPS1 |
PRPS1 knockdown reduces NAD+ levels, NAD+/NADH ratio, and cell viability in HEI-OC1 cells. (a) Western blot analysis of PRPS1 expression after transfection with PRPS1-siRNA or negative-siRNA, with tubulin as the internal control. (b) Quantification of PRPS1 expression levels from (a). Measurement of intracellular (c) NAD+ levels and (d) NAD+/NADH ratio in si-CTRL and si-PRPS1 groups. Measurement of intracellular (e) NAD+ levels and (f) NAD+/NADH ratio in si-PRPS1 and si-PRPS1+NMN groups. (g) Cell viability assessed by CCK-8 assay. Data are presented as three independent experiments’ mean ± SD. ∗∗∗p < 0.001 and ∗∗∗∗p < 0.0001 compared with the si-CTRL; ####p < 0.0001 compared with the si-PRPS1. |
PRPS1 knockdown reduces NAD+ levels, NAD+/NADH ratio, and cell viability in HEI-OC1 cells. (a) Western blot analysis of PRPS1 expression after transfection with PRPS1-siRNA or negative-siRNA, with tubulin as the internal control. (b) Quantification of PRPS1 expression levels from (a). Measurement of intracellular (c) NAD+ levels and (d) NAD+/NADH ratio in si-CTRL and si-PRPS1 groups. Measurement of intracellular (e) NAD+ levels and (f) NAD+/NADH ratio in si-PRPS1 and si-PRPS1+NMN groups. (g) Cell viability assessed by CCK-8 assay. Data are presented as three independent experiments’ mean ± SD. ∗∗∗p < 0.001 and ∗∗∗∗p < 0.0001 compared with the si-CTRL; ####p < 0.0001 compared with the si-PRPS1. |
PRPS1 knockdown reduces NAD+ levels, NAD+/NADH ratio, and cell viability in HEI-OC1 cells. (a) Western blot analysis of PRPS1 expression after transfection with PRPS1-siRNA or negative-siRNA, with tubulin as the internal control. (b) Quantification of PRPS1 expression levels from (a). Measurement of intracellular (c) NAD+ levels and (d) NAD+/NADH ratio in si-CTRL and si-PRPS1 groups. Measurement of intracellular (e) NAD+ levels and (f) NAD+/NADH ratio in si-PRPS1 and si-PRPS1+NMN groups. (g) Cell viability assessed by CCK-8 assay. Data are presented as three independent experiments’ mean ± SD. ∗∗∗p < 0.001 and ∗∗∗∗p < 0.0001 compared with the si-CTRL; ####p < 0.0001 compared with the si-PRPS1 |
PRPS1 knockdown reduces NAD+ levels, NAD+/NADH ratio, and cell viability in HEI-OC1 cells. (a) Western blot analysis of PRPS1 expression after transfection with PRPS1-siRNA or negative-siRNA, with tubulin as the internal control. (b) Quantification of PRPS1 expression levels from (a). Measurement of intracellular (c) NAD+ levels and (d) NAD+/NADH ratio in si-CTRL and si-PRPS1 groups. Measurement of intracellular (e) NAD+ levels and (f) NAD+/NADH ratio in si-PRPS1 and si-PRPS1+NMN groups. (g) Cell viability assessed by CCK-8 assay. Data are presented as three independent experiments’ mean ± SD. ∗∗∗p < 0.001 and ∗∗∗∗p < 0.0001 compared with the si-CTRL; ####p < 0.0001 compared with the si-PRPS1. |
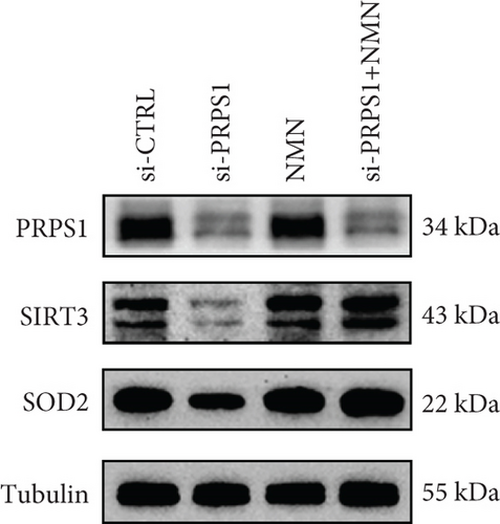
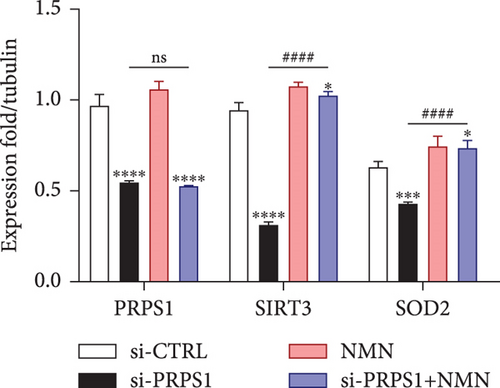
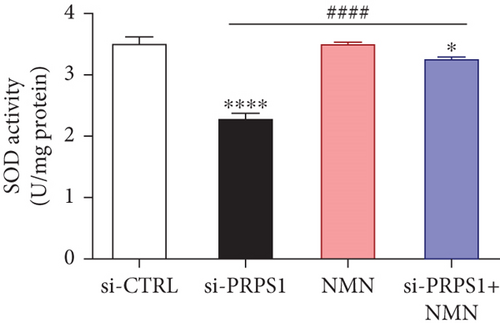
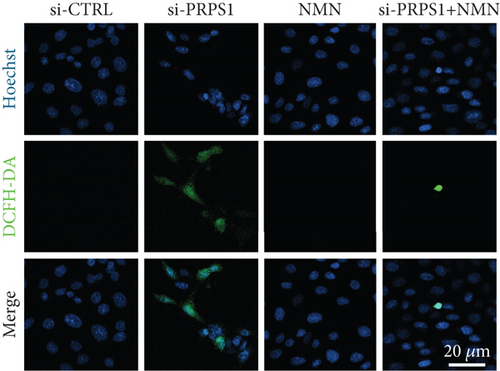
PRPS1 knockdown regulates intracellular ROS levels and mitochondrial function via the NAD+/SIRT3/SOD2 pathway in HEI-OC1 cells. (a) Western blot analysis of PRPS1, SIRT3, and SOD2, with tubulin as the internal control. (b) Quantification of protein expression levels from (a). (c) SOD activity measured using a total superoxide dismutase assay kit with WST-8. (d) Representative microscopic images of HEI-OC1 cells stained with DCFH-DA in each group. Scale bar = 20 μm. (e, f) Flow cytometry analysis of DCFH-DA staining, showing quantitative changes in green fluorescence. (g) Representative microscopic images of HEI-OC1 cells stained with TMRM in each group. Scale bar = 20 μm. (h, i) Flow cytometry analysis of TMRM staining, showing quantitative changes in fluorescence. Data are presented as mean ± SD from three independent experiments. ∗p < 0.05, ∗∗∗p < 0.001, and ∗∗∗∗p < 0.0001 compared with si-CTRL; ####p < 0.0001 compared with si-PRPS1. |
PRPS1 knockdown regulates intracellular ROS levels and mitochondrial function via the NAD+/SIRT3/SOD2 pathway in HEI-OC1 cells. (a) Western blot analysis of PRPS1, SIRT3, and SOD2, with tubulin as the internal control. (b) Quantification of protein expression levels from (a). (c) SOD activity measured using a total superoxide dismutase assay kit with WST-8. (d) Representative microscopic images of HEI-OC1 cells stained with DCFH-DA in each group. Scale bar = 20 μm. (e, f) Flow cytometry analysis of DCFH-DA staining, showing quantitative changes in green fluorescence. (g) Representative microscopic images of HEI-OC1 cells stained with TMRM in each group. Scale bar = 20 μm. (h, i) Flow cytometry analysis of TMRM staining, showing quantitative changes in fluorescence. Data are presented as mean ± SD from three independent experiments. ∗p < 0.05, ∗∗∗p < 0.001, and ∗∗∗∗p < 0.0001 compared with si-CTRL; ####p < 0.0001 compared with si-PRPS1 |
PRPS1 knockdown regulates intracellular ROS levels and mitochondrial function via the NAD+/SIRT3/SOD2 pathway in HEI-OC1 cells. (a) Western blot analysis of PRPS1, SIRT3, and SOD2, with tubulin as the internal control. (b) Quantification of protein expression levels from (a). (c) SOD activity measured using a total superoxide dismutase assay kit with WST-8. (d) Representative microscopic images of HEI-OC1 cells stained with DCFH-DA in each group. Scale bar = 20 μm. (e, f) Flow cytometry analysis of DCFH-DA staining, showing quantitative changes in green fluorescence. (g) Representative microscopic images of HEI-OC1 cells stained with TMRM in each group. Scale bar = 20 μm. (h, i) Flow cytometry analysis of TMRM staining, showing quantitative changes in fluorescence. Data are presented as mean ± SD from three independent experiments. ∗p < 0.05, ∗∗∗p < 0.001, and ∗∗∗∗p < 0.0001 compared with si-CTRL; ####p < 0.0001 compared with si-PRPS1. |
PRPS1 knockdown regulates intracellular ROS levels and mitochondrial function via the NAD+/SIRT3/SOD2 pathway in HEI-OC1 cells. (a) Western blot analysis of PRPS1, SIRT3, and SOD2, with tubulin as the internal control. (b) Quantification of protein expression levels from (a). (c) SOD activity measured using a total superoxide dismutase assay kit with WST-8. (d) Representative microscopic images of HEI-OC1 cells stained with DCFH-DA in each group. Scale bar = 20 μm. (e, f) Flow cytometry analysis of DCFH-DA staining, showing quantitative changes in green fluorescence. (g) Representative microscopic images of HEI-OC1 cells stained with TMRM in each group. Scale bar = 20 μm. (h, i) Flow cytometry analysis of TMRM staining, showing quantitative changes in fluorescence. Data are presented as mean ± SD from three independent experiments. ∗p < 0.05, ∗∗∗p < 0.001, and ∗∗∗∗p < 0.0001 compared with si-CTRL; ####p < 0.0001 compared with si-PRPS1. |
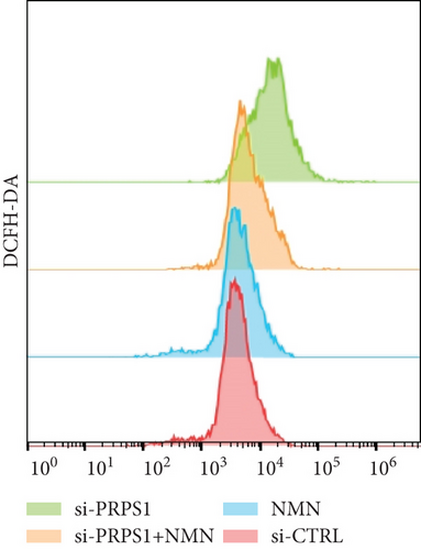
PRPS1 knockdown regulates intracellular ROS levels and mitochondrial function via the NAD+/SIRT3/SOD2 pathway in HEI-OC1 cells. (a) Western blot analysis of PRPS1, SIRT3, and SOD2, with tubulin as the internal control. (b) Quantification of protein expression levels from (a). (c) SOD activity measured using a total superoxide dismutase assay kit with WST-8. (d) Representative microscopic images of HEI-OC1 cells stained with DCFH-DA in each group. Scale bar = 20 μm. (e, f) Flow cytometry analysis of DCFH-DA staining, showing quantitative changes in green fluorescence. (g) Representative microscopic images of HEI-OC1 cells stained with TMRM in each group. Scale bar = 20 μm. (h, i) Flow cytometry analysis of TMRM staining, showing quantitative changes in fluorescence. Data are presented as mean ± SD from three independent experiments. ∗p < 0.05, ∗∗∗p < 0.001, and ∗∗∗∗p < 0.0001 compared with si-CTRL; ####p < 0.0001 compared with si-PRPS1. |
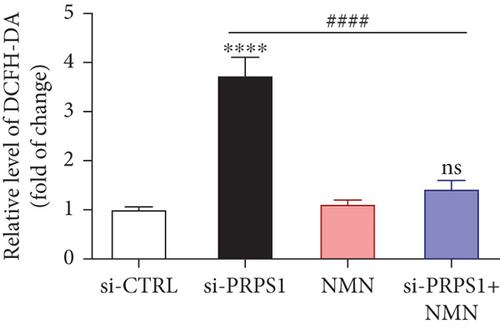
PRPS1 knockdown regulates intracellular ROS levels and mitochondrial function via the NAD+/SIRT3/SOD2 pathway in HEI-OC1 cells. (a) Western blot analysis of PRPS1, SIRT3, and SOD2, with tubulin as the internal control. (b) Quantification of protein expression levels from (a). (c) SOD activity measured using a total superoxide dismutase assay kit with WST-8. (d) Representative microscopic images of HEI-OC1 cells stained with DCFH-DA in each group. Scale bar = 20 μm. (e, f) Flow cytometry analysis of DCFH-DA staining, showing quantitative changes in green fluorescence. (g) Representative microscopic images of HEI-OC1 cells stained with TMRM in each group. Scale bar = 20 μm. (h, i) Flow cytometry analysis of TMRM staining, showing quantitative changes in fluorescence. Data are presented as mean ± SD from three independent experiments. ∗p < 0.05, ∗∗∗p < 0.001, and ∗∗∗∗p < 0.0001 compared with si-CTRL; ####p < 0.0001 compared with si-PRPS1. |
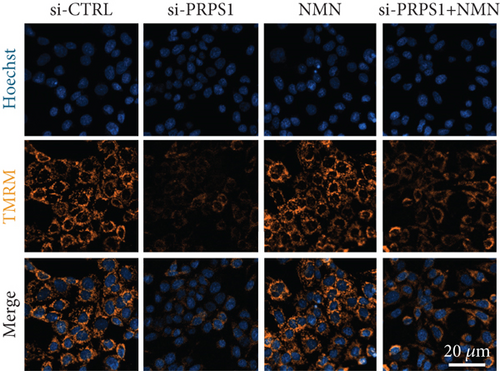
PRPS1 knockdown regulates intracellular ROS levels and mitochondrial function via the NAD+/SIRT3/SOD2 pathway in HEI-OC1 cells. (a) Western blot analysis of PRPS1, SIRT3, and SOD2, with tubulin as the internal control. (b) Quantification of protein expression levels from (a). (c) SOD activity measured using a total superoxide dismutase assay kit with WST-8. (d) Representative microscopic images of HEI-OC1 cells stained with DCFH-DA in each group. Scale bar = 20 μm. (e, f) Flow cytometry analysis of DCFH-DA staining, showing quantitative changes in green fluorescence. (g) Representative microscopic images of HEI-OC1 cells stained with TMRM in each group. Scale bar = 20 μm. (h, i) Flow cytometry analysis of TMRM staining, showing quantitative changes in fluorescence. Data are presented as mean ± SD from three independent experiments. ∗p < 0.05, ∗∗∗p < 0.001, and ∗∗∗∗p < 0.0001 compared with si-CTRL; ####p < 0.0001 compared with si-PRPS1. |
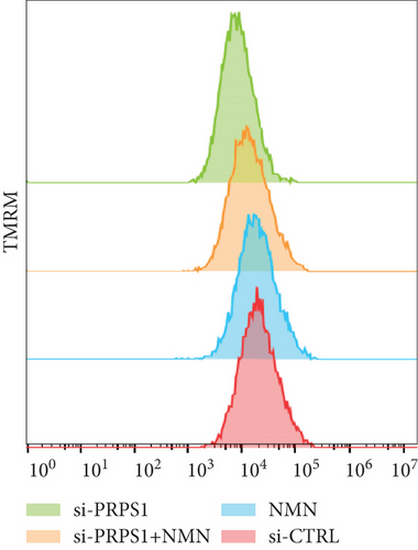
PRPS1 knockdown regulates intracellular ROS levels and mitochondrial function via the NAD+/SIRT3/SOD2 pathway in HEI-OC1 cells. (a) Western blot analysis of PRPS1, SIRT3, and SOD2, with tubulin as the internal control. (b) Quantification of protein expression levels from (a). (c) SOD activity measured using a total superoxide dismutase assay kit with WST-8. (d) Representative microscopic images of HEI-OC1 cells stained with DCFH-DA in each group. Scale bar = 20 μm. (e, f) Flow cytometry analysis of DCFH-DA staining, showing quantitative changes in green fluorescence. (g) Representative microscopic images of HEI-OC1 cells stained with TMRM in each group. Scale bar = 20 μm. (h, i) Flow cytometry analysis of TMRM staining, showing quantitative changes in fluorescence. Data are presented as mean ± SD from three independent experiments. ∗p < 0.05, ∗∗∗p < 0.001, and ∗∗∗∗p < 0.0001 compared with si-CTRL; ####p < 0.0001 compared with si-PRPS1. |
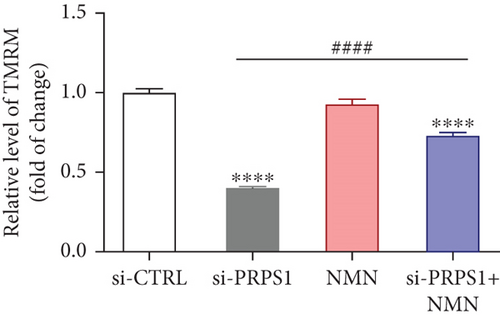
PRPS1 knockdown regulates intracellular ROS levels and mitochondrial function via the NAD+/SIRT3/SOD2 pathway in HEI-OC1 cells. (a) Western blot analysis of PRPS1, SIRT3, and SOD2, with tubulin as the internal control. (b) Quantification of protein expression levels from (a). (c) SOD activity measured using a total superoxide dismutase assay kit with WST-8. (d) Representative microscopic images of HEI-OC1 cells stained with DCFH-DA in each group. Scale bar = 20 μm. (e, f) Flow cytometry analysis of DCFH-DA staining, showing quantitative changes in green fluorescence. (g) Representative microscopic images of HEI-OC1 cells stained with TMRM in each group. Scale bar = 20 μm. (h, i) Flow cytometry analysis of TMRM staining, showing quantitative changes in fluorescence. Data are presented as mean ± SD from three independent experiments. ∗p < 0.05, ∗∗∗p < 0.001, and ∗∗∗∗p < 0.0001 compared with si-CTRL; ####p < 0.0001 compared with si-PRPS1. |
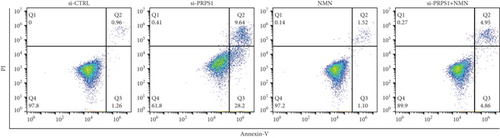
PRPS1 knockdown increases apoptosis in HEI-OC1 cells. (a, b) Apoptotic cells detected by flow cytometry in each group. (c) Western blot analysis of proapoptotic proteins Bax, Cytochrome c, Smac/Diablo, and antiapoptotic protein Bcl-2, with tubulin as the internal control. (d) Quantification of protein expression levels from (c). Data are presented as mean ± SD from three independent experiments. ∗∗∗p < 0.001 and ∗∗∗∗p < 0.0001 compared with si-CTRL; ####p < 0.0001 compared with si-PRPS1. |
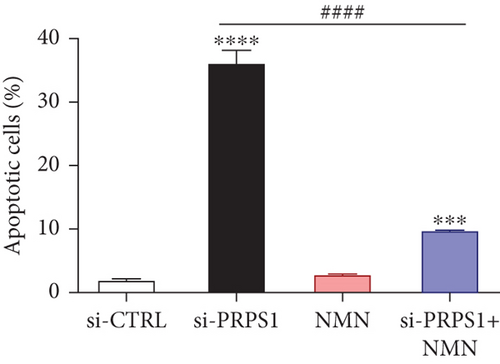
PRPS1 knockdown increases apoptosis in HEI-OC1 cells. (a, b) Apoptotic cells detected by flow cytometry in each group. (c) Western blot analysis of proapoptotic proteins Bax, Cytochrome c, Smac/Diablo, and antiapoptotic protein Bcl-2, with tubulin as the internal control. (d) Quantification of protein expression levels from (c). Data are presented as mean ± SD from three independent experiments. ∗∗∗p < 0.001 and ∗∗∗∗p < 0.0001 compared with si-CTRL; ####p < 0.0001 compared with si-PRPS1. |
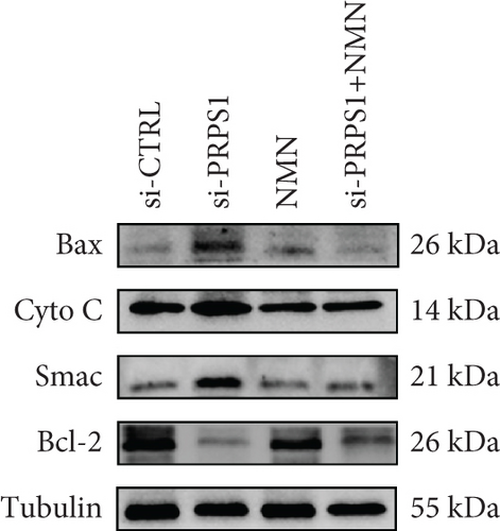
PRPS1 knockdown increases apoptosis in HEI-OC1 cells. (a, b) Apoptotic cells detected by flow cytometry in each group. (c) Western blot analysis of proapoptotic proteins Bax, Cytochrome c, Smac/Diablo, and antiapoptotic protein Bcl-2, with tubulin as the internal control. (d) Quantification of protein expression levels from (c). Data are presented as mean ± SD from three independent experiments. ∗∗∗p < 0.001 and ∗∗∗∗p < 0.0001 compared with si-CTRL; ####p < 0.0001 compared with si-PRPS1. |
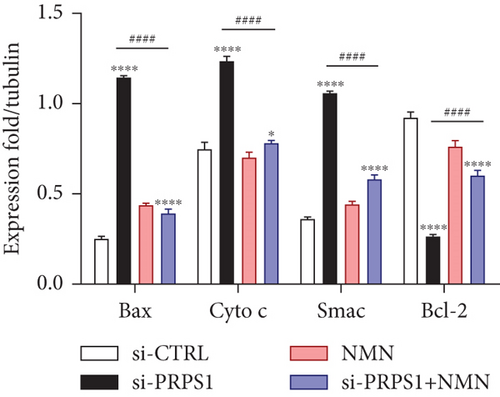
PRPS1 knockdown increases apoptosis in HEI-OC1 cells. (a, b) Apoptotic cells detected by flow cytometry in each group. (c) Western blot analysis of proapoptotic proteins Bax, Cytochrome c, Smac/Diablo, and antiapoptotic protein Bcl-2, with tubulin as the internal control. (d) Quantification of protein expression levels from (c). Data are presented as mean ± SD from three independent experiments. ∗∗∗p < 0.001 and ∗∗∗∗p < 0.0001 compared with si-CTRL; ####p < 0.0001 compared with si-PRPS1. |