
Fig. 4f
- ID
- ZDB-IMAGE-250828-60
- Publication
- Wan et al., 2025 - Identification and Functional Characterization of a Novel PRPS1 Variant in X-Linked Nonsyndromic Hearing Loss: Insights From Zebrafish and Cellular Models
- All Figures
- Figures for Wan et al., 2025
|
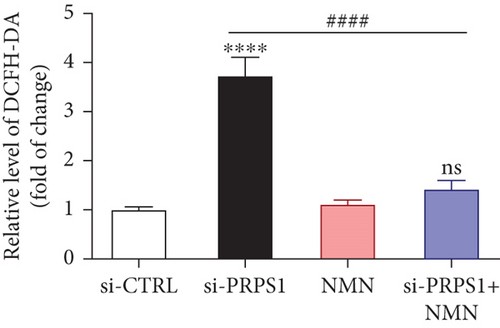
Fig. 4f PRPS1 knockdown regulates intracellular ROS levels and mitochondrial function via the NAD+/SIRT3/SOD2 pathway in HEI-OC1 cells. (a) Western blot analysis of PRPS1, SIRT3, and SOD2, with tubulin as the internal control. (b) Quantification of protein expression levels from (a). (c) SOD activity measured using a total superoxide dismutase assay kit with WST-8. (d) Representative microscopic images of HEI-OC1 cells stained with DCFH-DA in each group. Scale bar = 20 μm. (e, f) Flow cytometry analysis of DCFH-DA staining, showing quantitative changes in green fluorescence. (g) Representative microscopic images of HEI-OC1 cells stained with TMRM in each group. Scale bar = 20 μm. (h, i) Flow cytometry analysis of TMRM staining, showing quantitative changes in fluorescence. Data are presented as mean ± SD from three independent experiments. ∗p < 0.05, ∗∗∗p < 0.001, and ∗∗∗∗p < 0.0001 compared with si-CTRL; ####p < 0.0001 compared with si-PRPS1.