
IMAGE
Fig. 5a
- ID
- ZDB-IMAGE-250828-64
- Publication
- Wan et al., 2025 - Identification and Functional Characterization of a Novel PRPS1 Variant in X-Linked Nonsyndromic Hearing Loss: Insights From Zebrafish and Cellular Models
- All Figures
- Figures for Wan et al., 2025
Image
|
Figure Caption
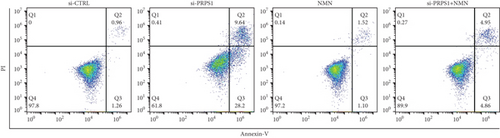
Fig. 5a PRPS1 knockdown increases apoptosis in HEI-OC1 cells. (a, b) Apoptotic cells detected by flow cytometry in each group. (c) Western blot analysis of proapoptotic proteins Bax, Cytochrome c, Smac/Diablo, and antiapoptotic protein Bcl-2, with tubulin as the internal control. (d) Quantification of protein expression levels from (c). Data are presented as mean ± SD from three independent experiments. ∗∗∗p < 0.001 and ∗∗∗∗p < 0.0001 compared with si-CTRL; ####p < 0.0001 compared with si-PRPS1.
Acknowledgments
This image is the copyrighted work of the attributed author or publisher, and
ZFIN has permission only to display this image to its users.
Additional permissions should be obtained from the applicable author or publisher of the image.
Full text @ Hum. Mutat.