
- Title
-
Modeling Pseudomonas aeruginosa-Staphylococcus aureus interactions in zebrafish to assess the host inflammatory response upon co-infection
- Authors
- Costes, F., Nilly, F., Rousset, A., Pont, S., Moreau, K., Blanc-Potard, A.B.
- Source
- Full text @ Sci. Rep.
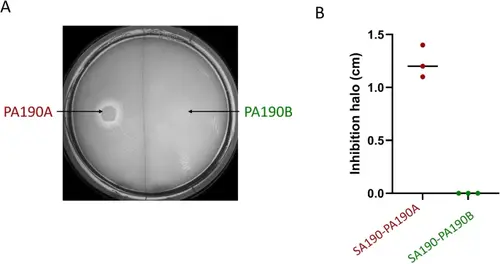
In vitro competitive or coexistent phenotypes of P. aeruginosa and S. aureus strains. (A). Visualization of competition on agar plate. TSA plates were inoculated with a loan of S. aureus SA190 culture and a drop of P. aeruginosa PA190A and PA190B suspension was placed on the plate (indicated by the arrows). Plates were incubated for 24 h at 37 °C. (B) Diameter size of the inhibition halo was determined from three independent experiments. |
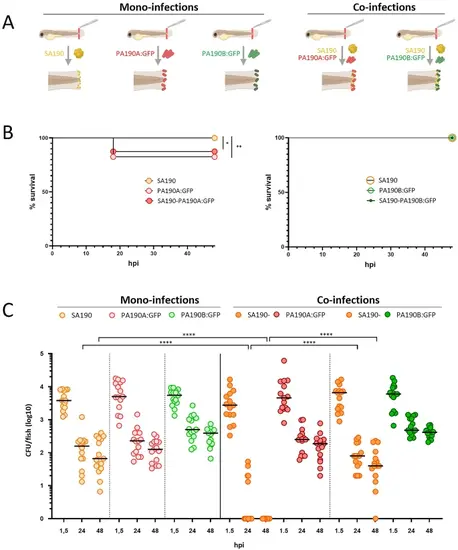
Virulence and persistence profiles of strains from trio 190 in mono- or co-infections in zebrafish. (A) Diagram of mono- and co-infections (created with BioRender.com). (B) Survival curves upon mono- and co-infections of zebrafish larvae (immersion of wounded larvae) with competitive strain PA190A: GFP (left panel) or coexistent strain PA190B: GFP (right panel). Survival was monitored for 48 h following the infection (n = 2, 40 larvae). Log-rang test: *P < 0.05 and **P < 0.01. (C) Bacterial CFUs (horizontal black lines indicate the median) counts from live larvae at different times after mono- or co-infections (1.5, 24 or 48 hpi). Experiments (n = 3, 5 larvae per experiment and time point). The data represent independent measurements from different larvae at each time point. Statistical analysis is made between mono- and co-infection conditions. Mann-Whitney test: ****P < 0.0001. |
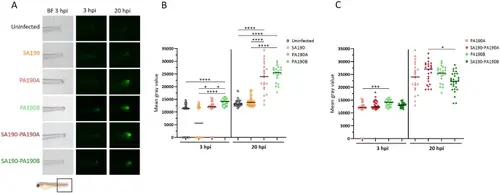
Inflammation in a mono- or co-infection context upon infection of a zebrafish il1b:GFP reporter line. (A) Images of the GFP signal at the infection site (indicated by a black square below the images) in il1b: GFP larvae. Larvae wounded at the tail were infected by immersion with SA190 and/or competitive strain PA190A or coexistent strain PA190B and imaged at 3 hpi or 20 hpi (the same larva is imaged at the two time points). BF = Bright-Field. (B) Quantification of the GFP signal in mono-infected larvae and non-infected injured embryos. Black bars represent medians. Kruskal-Wallis test: *P < 0.05, ****P < 0.0001. (C) Quantification of the GFP signal in larvae infected by PA190A or PA190B in the context of mono-infection or co-infection with SA190. Results from panels B and C were collected in the same experiments and the same dataset was used for mono-infections with PA190A and PA190B in both panels. Black bars represent medians. Kruskal-Wallis test: *P < 0.05, *** P < 0.001. Experiments have been performed at least three times (n ≥ 3), representing at least 22 fishes per condition. |
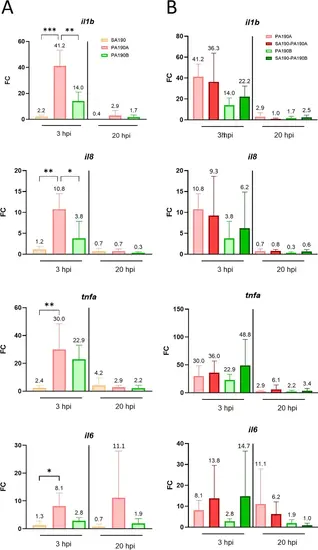
Expression of zebrafish pro-inflammatory genes in response to mono- and co-infections. Expression of il1b, il8, tnfa and il6 genes was measured using RT-qPCR and normalized with the expression of ef1a gene. RNA was extracted from 10 larvae after mono- or co-infections at 3 hpi and 20 hpi. (A) Inflammatory response upon mono-infections. (B) Inflammatory response caused by PA190A and PA190B in the context of mono- or co-infection. Results from panels A and B were collected in the same experiments and the same dataset was used for mono-infections with PA190A and PA190B in both panels. Data are presented as fold change (FC) of gene expression in infected larvae vs. non infected with FC = 2^(−ΔΔCT). Values are the means ± standard error of the mean (SEM) of four replicates (n = 4 from pools of 10 larvae per timepoint, 40 larvae in total). Statistical analysis was done using a one-way ANOVA followed by a Tukey post-hoc test. *P < 0.05; **P < 0.01; ***P < 0.001. |
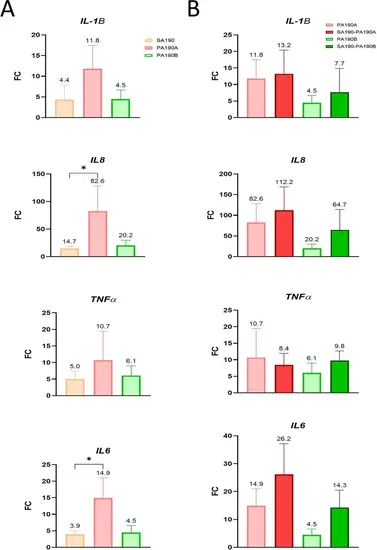
Expression of CFBE cells pro-inflammatory genes in response to mono- and co-infections. Expression of IL1B, IL8, TNFα and IL6 genes was measured using RT-qPCR and normalized with the expression of GAPDH and RPS18 genes. RNA was extracted from CFBE cells after 6 h of infection. (A) Inflammatory response upon mono-infections. (B) Inflammatory response caused by PA190A and PA190B in the context of mono- or co-infections. Results from panels A and B were collected in the same experiments and the same dataset was used for mono-infections with PA190A and PA190B in both panels. Data are presented as FC of gene expression of infected cells vs. non infected cells with FC = 2^(−ΔΔCT). Values are the means ± standard error of the mean (SEM) of four replicates. Statistical analyses were done using a Kruskal-Wallis test followed using a Dunn test. *P < 0.05. |