
|
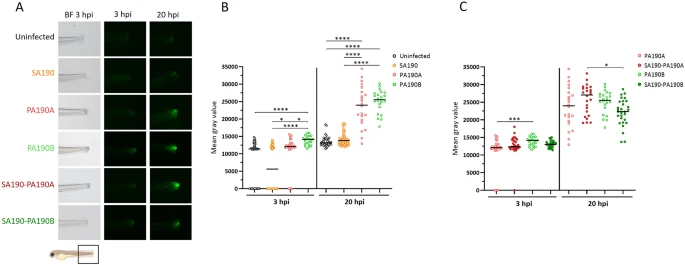
Fig. 3 Inflammation in a mono- or co-infection context upon infection of a zebrafish il1b:GFP reporter line. (A) Images of the GFP signal at the infection site (indicated by a black square below the images) in il1b: GFP larvae. Larvae wounded at the tail were infected by immersion with SA190 and/or competitive strain PA190A or coexistent strain PA190B and imaged at 3 hpi or 20 hpi (the same larva is imaged at the two time points). BF = Bright-Field. (B) Quantification of the GFP signal in mono-infected larvae and non-infected injured embryos. Black bars represent medians. Kruskal-Wallis test: *P < 0.05, ****P < 0.0001. (C) Quantification of the GFP signal in larvae infected by PA190A or PA190B in the context of mono-infection or co-infection with SA190. Results from panels B and C were collected in the same experiments and the same dataset was used for mono-infections with PA190A and PA190B in both panels. Black bars represent medians. Kruskal-Wallis test: *P < 0.05, *** P < 0.001. Experiments have been performed at least three times (n ≥ 3), representing at least 22 fishes per condition.