FIGURE SUMMARY
Title

Trimetazidine stimulates intracellular Ca2+ transients and zebrafish locomotor activity in spinal neurons

Authors
Bernardi, S., Vitolo, S., Gabellini, C., Marchese, M., Ferraro, E.
Source
Full text @ Sci. Rep.

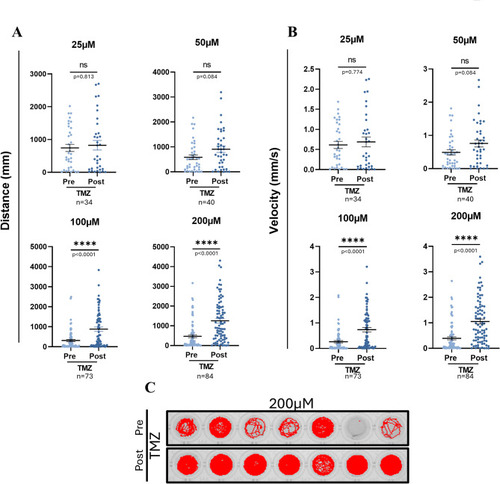
Locomotor behavior in TMZ-treated zebrafish larvae. (A) Distance traveled (mm) and (B) velocity (mm/s) of zebrafish larvae pre- and post-TMZ administration at increasing TMZ concentrations. (C) Representative movement track pre- and post-TMZ (200µM) administration. n range = 34–84 larvae/group; specifically indicated in each panel. Statistical analysis was performed using the paired Wilcoxon test- Asterisks denote significance; ****p ≤ 0.0001). Data are presented as Mean ± SEM.

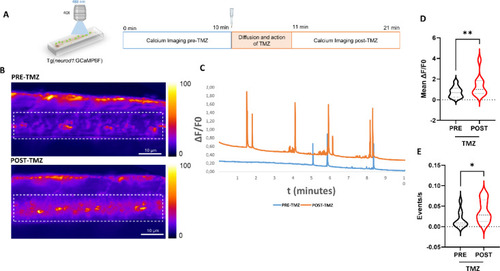
Spinal cord Ca2+ imaging upon TMZ exposure. (A) Ca2+ imaging in spinal cord neurons of Tg(neurod1:GCaMP6f) larvae was performed 10 minutes (min) before 100 µM TMZ treatment for baseline recordings (PRE-TMZ). After TMZ administration and after a TMZ-diffusion time of 1 min, calcium imaging was resumed for other 10 min (POST-TMZ). (B) Representative z-projection images of the spinal cord Ca2+ imaging performed in the lateral caudal neurons of a single zebrafish larva before the treatment (PRE-TMZ) and after the treatment (POST-TMZ), the Region of Interest (ROI) is highlighted with the white dotted line). On the right side, the look up table color range of Ca2+ fluorescence is shown. (C) A representative graph from a single zebrafish larva shows the ∆F/F0 calcium fluorescent signal in spinal cord for each frame before and after TMZ treatment (D) The graph shows the full distribution of data with the median and quartiles of ∆F/F0 fluorescent signal in spinal neurons. (E) The graph shows full distribution of data, with median and quartiles of frequency fluorescent signal in spinal neurons n = 10 analyzed larvae. Statistical analysis was performed using the paired Wilcoxon test. Asterisks denote significance; *p ≤ 0.05, **p ≤ 0.01 (p of ∆F/F0 = 0.003; p of frequency = 0.01).

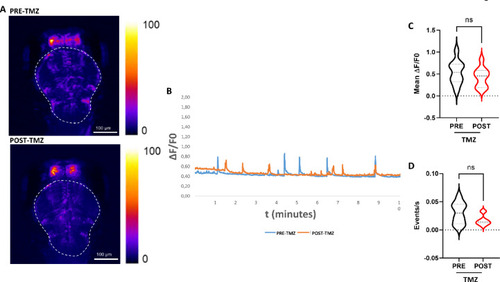
Whole brain Ca2+ imaging upon TMZ exposure. (A) Representative z-projection images of the whole brain Ca2+ imaging performed in the rostral-dorsally placed Tg(neurod1:GCaMP6f) larvae before the treatment (PRE-TMZ) and after the treatment (POST-TMZ). On the right side, the look up table color range of Ca2+ fluorescence is shown. Images were taken with 4X magnification objective. The dotted line indicates the analyzed ROI. (B) A representative graph from a single zebrafish larva shows the ∆F/F0 Ca2+ fluorescent signal in the whole brain for each frame before and after TMZ treatment (C) The graph shows full distribution of data, with median and quartiles of ∆F/F0 fluorescent signal in whole brain. (D) The graph shows full distribution of data, with median and quartiles of frequency fluorescent signal in whole brain. n = 10 analyzed larvae. Since the same individuals were analyzed before and after the treatment, statistical analysis was performed using the paired Wilcoxon test. ns: not significant, (p of ∆F/F0 = 0.19; p of frequency = 0.06;).

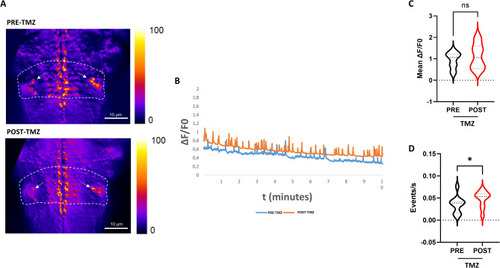
Hindbrain Ca2+ imaging upon TMZ exposure. (A) Representative z-projection images of the hindbrain calcium imaging performed in Tg(neurod1:GCaMP6f) larvae rostral-dorsally settled before the treatment (PRE-TMZ) and after the treatment (POST-TMZ). On the right side, the look up table color range of Ca2+ fluorescence is shown. The dotted line indicates the analyzed ROI, while the white arrows indicate the Mauthner cells localization. (B) A representative graph from a single zebrafish larva shows the ∆F/F0 Ca2+ fluorescent signal in hindbrain for each frame before and after TMZ treatment. (C) The graph shows full distribution of data, with median and quartiles of ∆F/F0 fluorescent signal in in the hindbrain. (D) The graph shows full distribution of data, with median and quartiles of frequency fluorescent signal in in the hindbrain n = 10 analyzed larvae. Statistical analysis was performed using the paired Wilcoxon test. *p ≤ 0.05, ns: not significant (p of ∆F/F0 = 0.13; p of frequency = 0.03).

Acknowledgments
This image is the copyrighted work of the attributed author or publisher, and ZFIN has permission only to display this image to its users. Additional permissions should be obtained from the applicable author or publisher of the image. Full text @ Sci. Rep.