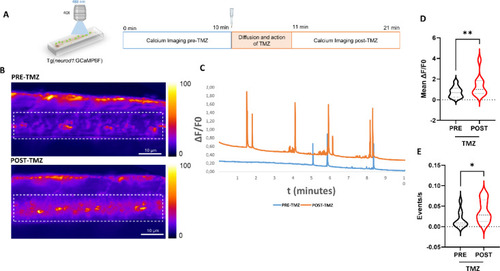
Spinal cord Ca2+ imaging upon TMZ exposure. (A) Ca2+ imaging in spinal cord neurons of Tg(neurod1:GCaMP6f) larvae was performed 10 minutes (min) before 100 µM TMZ treatment for baseline recordings (PRE-TMZ). After TMZ administration and after a TMZ-diffusion time of 1 min, calcium imaging was resumed for other 10 min (POST-TMZ). (B) Representative z-projection images of the spinal cord Ca2+ imaging performed in the lateral caudal neurons of a single zebrafish larva before the treatment (PRE-TMZ) and after the treatment (POST-TMZ), the Region of Interest (ROI) is highlighted with the white dotted line). On the right side, the look up table color range of Ca2+ fluorescence is shown. (C) A representative graph from a single zebrafish larva shows the ∆F/F0 calcium fluorescent signal in spinal cord for each frame before and after TMZ treatment (D) The graph shows the full distribution of data with the median and quartiles of ∆F/F0 fluorescent signal in spinal neurons. (E) The graph shows full distribution of data, with median and quartiles of frequency fluorescent signal in spinal neurons n = 10 analyzed larvae. Statistical analysis was performed using the paired Wilcoxon test. Asterisks denote significance; *p ≤ 0.05, **p ≤ 0.01 (p of ∆F/F0 = 0.003; p of frequency = 0.01).
|
