FIGURE

Fig. 3

ID
ZDB-FIG-250705-3
Publication
Bernardi et al., 2025 - Trimetazidine stimulates intracellular Ca2+ transients and zebrafish locomotor activity in spinal neurons
Other Figures
All Figure Page
Back to All Figure Page
Fig. 3

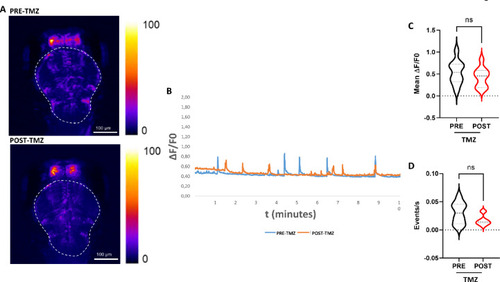
Whole brain Ca2+ imaging upon TMZ exposure. (A) Representative z-projection images of the whole brain Ca2+ imaging performed in the rostral-dorsally placed Tg(neurod1:GCaMP6f) larvae before the treatment (PRE-TMZ) and after the treatment (POST-TMZ). On the right side, the look up table color range of Ca2+ fluorescence is shown. Images were taken with 4X magnification objective. The dotted line indicates the analyzed ROI. (B) A representative graph from a single zebrafish larva shows the ∆F/F0 Ca2+ fluorescent signal in the whole brain for each frame before and after TMZ treatment (C) The graph shows full distribution of data, with median and quartiles of ∆F/F0 fluorescent signal in whole brain. (D) The graph shows full distribution of data, with median and quartiles of frequency fluorescent signal in whole brain. n = 10 analyzed larvae. Since the same individuals were analyzed before and after the treatment, statistical analysis was performed using the paired Wilcoxon test. ns: not significant, (p of ∆F/F0 = 0.19; p of frequency = 0.06;).

Expression Data

Expression Detail
Antibody Labeling
Phenotype Data

Phenotype Detail
Acknowledgments
This image is the copyrighted work of the attributed author or publisher, and ZFIN has permission only to display this image to its users. Additional permissions should be obtained from the applicable author or publisher of the image. Full text @ Sci. Rep.