IMAGE

Fig. 4

ID
ZDB-IMAGE-250705-7
Source
Figures for Bernardi et al., 2025
Image
Figure Caption

Fig. 4

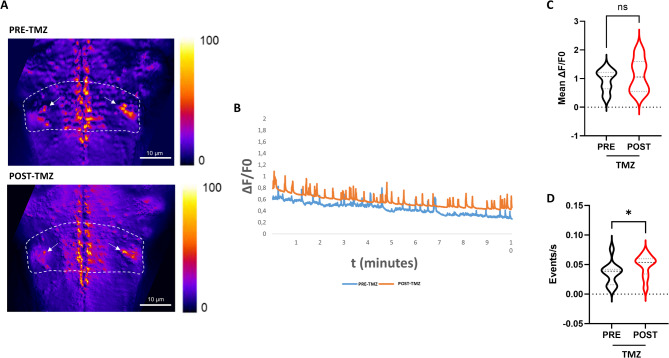
Hindbrain Ca2+ imaging upon TMZ exposure. (A) Representative z-projection images of the hindbrain calcium imaging performed in Tg(neurod1:GCaMP6f) larvae rostral-dorsally settled before the treatment (PRE-TMZ) and after the treatment (POST-TMZ). On the right side, the look up table color range of Ca2+ fluorescence is shown. The dotted line indicates the analyzed ROI, while the white arrows indicate the Mauthner cells localization. (B) A representative graph from a single zebrafish larva shows the ∆F/F0 Ca2+ fluorescent signal in hindbrain for each frame before and after TMZ treatment. (C) The graph shows full distribution of data, with median and quartiles of ∆F/F0 fluorescent signal in in the hindbrain. (D) The graph shows full distribution of data, with median and quartiles of frequency fluorescent signal in in the hindbrain n = 10 analyzed larvae. Statistical analysis was performed using the paired Wilcoxon test. *p ≤ 0.05, ns: not significant (p of ∆F/F0 = 0.13; p of frequency = 0.03).

Acknowledgments
This image is the copyrighted work of the attributed author or publisher, and ZFIN has permission only to display this image to its users. Additional permissions should be obtained from the applicable author or publisher of the image. Full text @ Sci. Rep.