FIGURE SUMMARY
Title

Benchmarking metabolic RNA labeling techniques for high-throughput single-cell RNA sequencing

Authors
Zhang, X., Peng, M., Zhu, J., Zhai, X., Wei, C., Jiao, H., Wu, Z., Huang, S., Liu, M., Li, W., Yang, W., Miao, K., Xu, Q., Chen, L., Hu, P.
Source
Full text @ Nat. Commun.

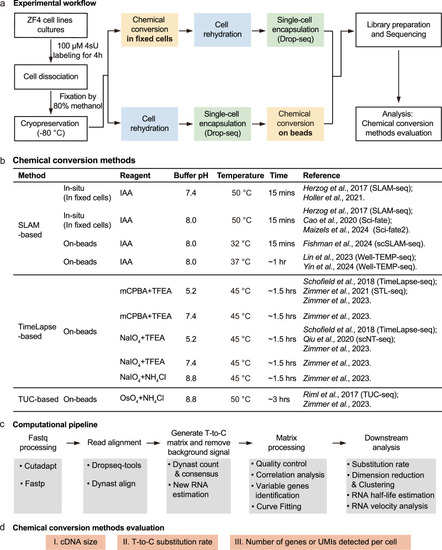
Experimental design for benchmarking chemical conversion methods.

a Workflow for high-throughput scRNA-seq using metabolic labeling in ZF4 cells. ZF4 cells were labeled with 4-thiouridine (4sU, 100 μM), followed by cell dissociation and fixation. Chemical conversion was performed either before or after single-cell encapsulation on the Drop-seq platform. Newly synthesized transcripts were detected via sequencing by identifying chemical-induced T-to-C substitutions. b Summary of the ten chemical conversion methods evaluated in this study, including key parameters such as the main reagent, buffer pH, temperature, reaction time, and relevant references. “In-situ” refers to chemical conversion occurring within intactly fixed cells, while “on-beads” indicates that the chemical conversion occurs after mRNA is released from the cells and captured on beads. IAA iodoacetamide, mCPBA meta-chloroperoxy-benzoic acid, TFEA 2,2,2-trifluoroethylamine, NaIO4 sodium periodate, NH4Cl ammonium chloride, OsO4 osmium tetroxide. c Computational pipeline for data processing, starting with fastq file pre-processing using Cutadapt and fastp, followed by read alignment with Dynast and Dropseq-tools. T-to-C substitutions were identified using Dynast, with R and Python scripts used for cell quality control, dimension reduction, new transcript identification, and RNA velocity analysis (see details in “Methods”). d Benchmarking criteria used to evaluate chemical conversion performance, focusing on cDNA size, T-to-C substitution rate, and the number of genes and unique molecular identifiers (UMIs) detected per cell.

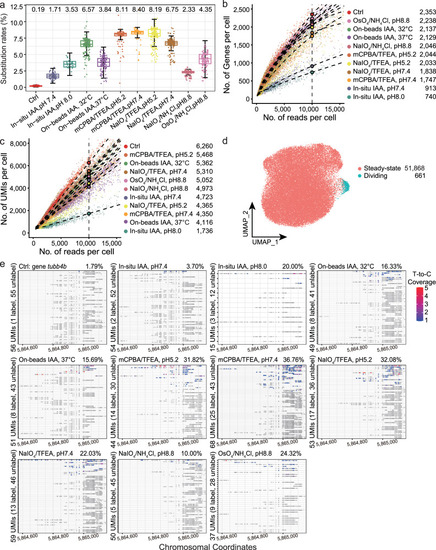
Comparison and evaluation of ten chemical conversion methods using ZF4 cells.

a Box plot showing T-to-C substitution rates across control and ten chemical conversion methods in 4sU-labeled ZF4 cells. “Ctrl” denotes the untreated control group (n = 7531 cells). The ten chemically treated groups, from left to right, contain: n = 1587, 789, 5581, 5267, 4692, 4639, 5360, 6461, 5389, and 5233 cells. Box plots show the median (center line), interquartile range (box), 1.5× interquartile range. Source data are provided as a Source Data file. b, c Scatterplots comparing the number of genes (b) or UMIs (c) detected per cell as a function of aligned reads per cell across the ten chemical conversion methods. Color indicates treatment methods. Fitted lines for each method are included, along with the predicted number of genes or UMIs detected per cell at a sequencing depth of 10,000 reads. In (b), the curve is smoothed using locally weighted regression (LOESS), while in (c), a linear model (LM) is applied. The estimated numbers of genes or UMIs at 10,000 reads are displayed on the right of the figure. Source data are provided as a Source Data file. d Uniform Manifold Approximation and Projection (UMAP) visualization showing integrated control and datasets from the ten chemical conversion methods, representing 52,529 ZF4 cells. Cells are colored by cell type. The numbers of cells in each group are also indicated. e Visualization of unique transcripts (UMIs) of the cell-cycle gene tubb4b from individual ZF4 cells in the control group and across the ten chemical conversion methods. Grey circles represent uridines without T-to-C substitution, while crosses (“X“s) indicate uridines with T-to-C substitutions in at least one read. The read coverage for each T-to-C substitution is displayed with color scaling.

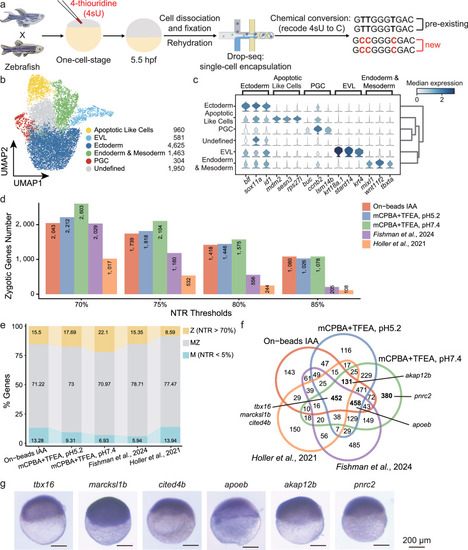
Identification of zygotically activated transcripts in zebrafish embryogenesis using improved chemical conversion methods.

a Zebrafish embryos were injected at the one-cell stage with 4-thiouridine (4sU, red), which incorporates into newly transcribed zygotic mRNA, leaving pre-existing maternal mRNA unlabeled. Embryos were collected at 5.5 h post-fertilization (hpf), dissociated into single cells, and analyzed using the Drop-seq platform with improved chemical conversion methods, inducing T-to-C substitutions in newly transcribed (zygotic) mRNA. b Uniform Manifold Approximation and Projection (UMAP) projection of 9883 single cells from zebrafish embryos at 5.5 hpf, colored by six cell-type clusters. The number of cells in each group is indicated. EVL enveloping layer, PGC primordial germ cell. c Violin plot displaying the marker genes for identified cell clusters. The expression level of each marker gene is color-coded based on the median expression in each cluster, with the color gradient ranging from light blue (low expression) to dark blue (high expression), scaled across all clusters. d Histogram depicting the number of identified zygotic genes across three chemical conversion methods in our study, compared to published data7,8. The x-axis represents different new-to-total RNA ratio (NTR) thresholds, while the y-axis and the numbers within the bars indicate the gene counts. Source data are provided as a Source Data file. e Stacked bar chart showing the proportions of identified maternal (M), maternal-zygotic (MZ), and zygotic (Z) genes (NTR > 70%) across three chemical conversion methods in our study compared to published data7,8. Colors indicate gene types. f Venn diagram showing the overlap of defined zygotic genes from (e) among different chemical conversion methods and published studies, highlighting both unique and shared genes. Tbx16, marcksl1b, and cited4b are identified in all datasets. Apoeb is uniquely identified in the on-beads methods across four datasets, excluding the in-situ chemical conversion study by ref. 8. Akap12b is detected in four datasets, excluding the study by ref. 7. Pnrc2 is exclusively detected in our mCPBA/TFEA method (pH 7.4). g In-situ hybridization staining validation of 5.5 hpf zebrafish embryos for mRNAs of zygotic genes indicated in (f). Scale bar: 200 μm. Each staining pattern was visualized in three independent samples and yielded similar results.

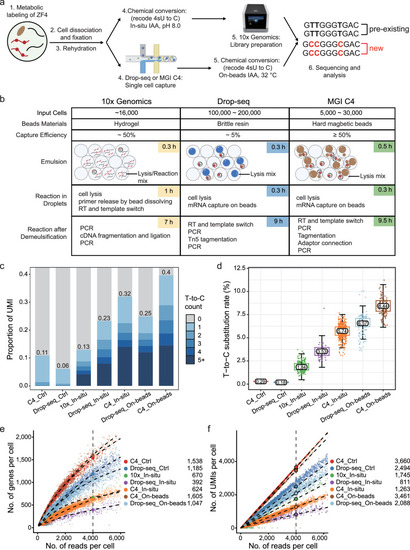
Comparison between 10× Genomics, Drop-seq and MGI C4 high-throughput single-cell platforms.

a Overview of metabolic labeling high-throughput scRNA-seq using 10× Genomics, Drop-seq, and MGI C4 platforms in ZF4 cells. Both platforms are capable of performing on-beads chemical conversion reactions during the library preparation steps. b Schematic comparison of the three high-throughput scRNA-seq platforms, highlighting differences in input cell quantity, beads materials, capture efficiency, time consumption, and key steps involved in library preparation. RT reverse transcription. c Proportion of UMIs containing T-to-C substitutions under different conditions and platforms. The color gradient indicates the number of T-to-C substitutions per read, with darker shades representing a higher number of substitutions within the UMI. “Ctrl” represents the control group without chemical treatment; “In-situ” refers to “In-situ IAA, pH8.0” method, while “on-beads” indicates “On-beads IAA, 32 °C” chemistry in (cf). Source data are provided as a Source Data file. d Box plot showing T-to-C substitution rates across the scRNA-seq platforms. Different colored boxes represent various platforms and treatment methods. The box edges correspond to the 25th and 75th percentiles, with the x-axis displaying types of base substitutions. Ctrl represents the control sample without chemical treatment. Source data are provided as a Source Data file. e, f Scatterplots showing the number of genes (e) or UMIs (f) detected per cell as a function of aligned reads per cell across the different platforms. Different colored dots represent various platforms and treatment methods. Fitted lines and predicted numbers of genes or UMIs detected per cell at 4000 reads are shown for each platform. The predicted values for 4000 reads are displayed in the upper left corner of the figure. The curve in (e) is smoothed using locally weighted regression, while in (f) is smoothed using a linear model.

Acknowledgments
This image is the copyrighted work of the attributed author or publisher, and ZFIN has permission only to display this image to its users. Additional permissions should be obtained from the applicable author or publisher of the image. Full text @ Nat. Commun.