IMAGE

Fig. 4

ID
ZDB-IMAGE-250703-42
Source
Figures for Zhang et al., 2025
Image
Figure Caption

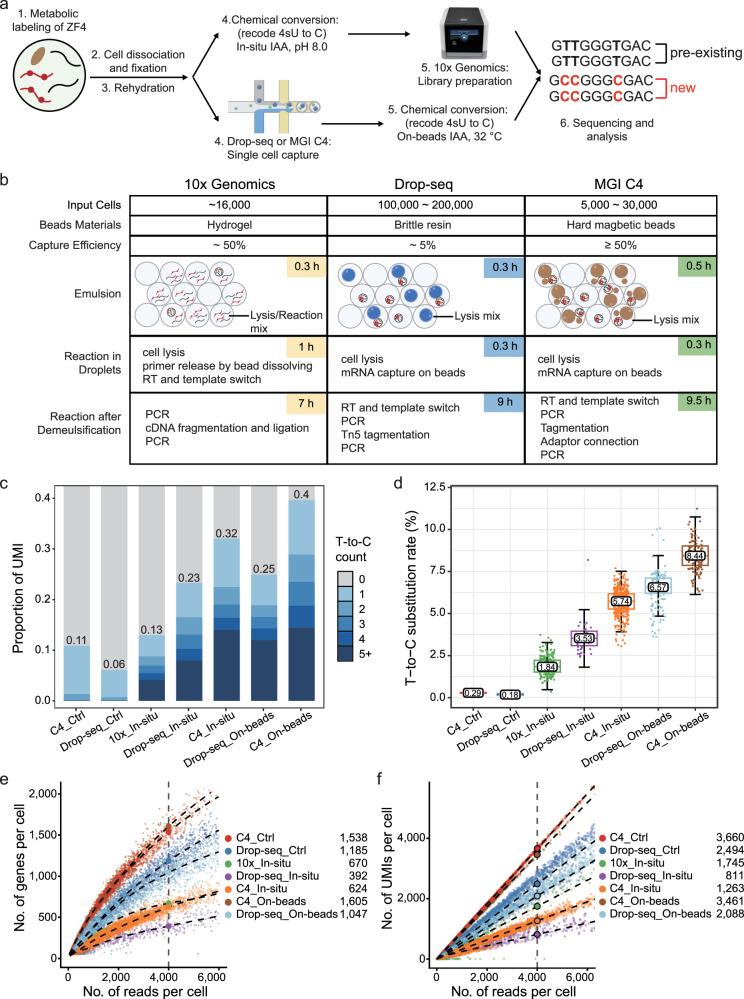
Fig. 4 Comparison between 10× Genomics, Drop-seq and MGI C4 high-throughput single-cell platforms.

a Overview of metabolic labeling high-throughput scRNA-seq using 10× Genomics, Drop-seq, and MGI C4 platforms in ZF4 cells. Both platforms are capable of performing on-beads chemical conversion reactions during the library preparation steps. b Schematic comparison of the three high-throughput scRNA-seq platforms, highlighting differences in input cell quantity, beads materials, capture efficiency, time consumption, and key steps involved in library preparation. RT reverse transcription. c Proportion of UMIs containing T-to-C substitutions under different conditions and platforms. The color gradient indicates the number of T-to-C substitutions per read, with darker shades representing a higher number of substitutions within the UMI. “Ctrl” represents the control group without chemical treatment; “In-situ” refers to “In-situ IAA, pH8.0” method, while “on-beads” indicates “On-beads IAA, 32 °C” chemistry in (cf). Source data are provided as a Source Data file. d Box plot showing T-to-C substitution rates across the scRNA-seq platforms. Different colored boxes represent various platforms and treatment methods. The box edges correspond to the 25th and 75th percentiles, with the x-axis displaying types of base substitutions. Ctrl represents the control sample without chemical treatment. Source data are provided as a Source Data file. e, f Scatterplots showing the number of genes (e) or UMIs (f) detected per cell as a function of aligned reads per cell across the different platforms. Different colored dots represent various platforms and treatment methods. Fitted lines and predicted numbers of genes or UMIs detected per cell at 4000 reads are shown for each platform. The predicted values for 4000 reads are displayed in the upper left corner of the figure. The curve in (e) is smoothed using locally weighted regression, while in (f) is smoothed using a linear model.

Acknowledgments
This image is the copyrighted work of the attributed author or publisher, and ZFIN has permission only to display this image to its users. Additional permissions should be obtained from the applicable author or publisher of the image. Full text @ Nat. Commun.