IMAGE

Fig. 3

ID
ZDB-IMAGE-250703-41
Source
Figures for Zhang et al., 2025
Image
Figure Caption

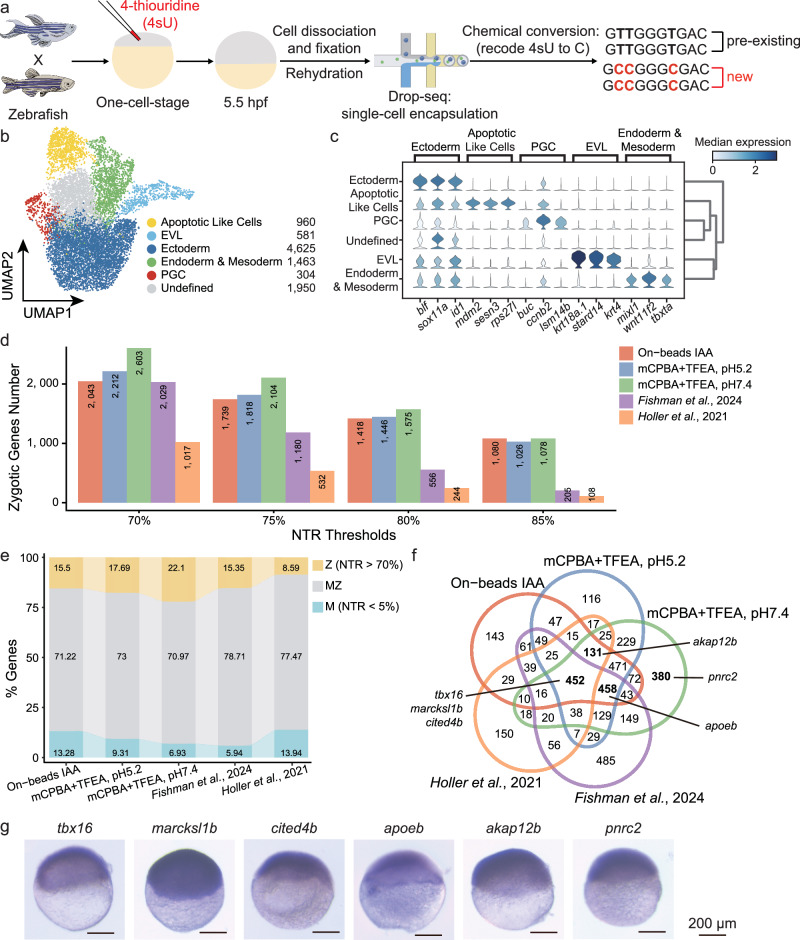
Fig. 3 Identification of zygotically activated transcripts in zebrafish embryogenesis using improved chemical conversion methods.

a Zebrafish embryos were injected at the one-cell stage with 4-thiouridine (4sU, red), which incorporates into newly transcribed zygotic mRNA, leaving pre-existing maternal mRNA unlabeled. Embryos were collected at 5.5 h post-fertilization (hpf), dissociated into single cells, and analyzed using the Drop-seq platform with improved chemical conversion methods, inducing T-to-C substitutions in newly transcribed (zygotic) mRNA. b Uniform Manifold Approximation and Projection (UMAP) projection of 9883 single cells from zebrafish embryos at 5.5 hpf, colored by six cell-type clusters. The number of cells in each group is indicated. EVL enveloping layer, PGC primordial germ cell. c Violin plot displaying the marker genes for identified cell clusters. The expression level of each marker gene is color-coded based on the median expression in each cluster, with the color gradient ranging from light blue (low expression) to dark blue (high expression), scaled across all clusters. d Histogram depicting the number of identified zygotic genes across three chemical conversion methods in our study, compared to published data7,8. The x-axis represents different new-to-total RNA ratio (NTR) thresholds, while the y-axis and the numbers within the bars indicate the gene counts. Source data are provided as a Source Data file. e Stacked bar chart showing the proportions of identified maternal (M), maternal-zygotic (MZ), and zygotic (Z) genes (NTR > 70%) across three chemical conversion methods in our study compared to published data7,8. Colors indicate gene types. f Venn diagram showing the overlap of defined zygotic genes from (e) among different chemical conversion methods and published studies, highlighting both unique and shared genes. Tbx16, marcksl1b, and cited4b are identified in all datasets. Apoeb is uniquely identified in the on-beads methods across four datasets, excluding the in-situ chemical conversion study by ref. 8. Akap12b is detected in four datasets, excluding the study by ref. 7. Pnrc2 is exclusively detected in our mCPBA/TFEA method (pH 7.4). g In-situ hybridization staining validation of 5.5 hpf zebrafish embryos for mRNAs of zygotic genes indicated in (f). Scale bar: 200 μm. Each staining pattern was visualized in three independent samples and yielded similar results.

Acknowledgments
This image is the copyrighted work of the attributed author or publisher, and ZFIN has permission only to display this image to its users. Additional permissions should be obtained from the applicable author or publisher of the image. Full text @ Nat. Commun.