
- Title
-
Estradiol promotes habituation learning via an unidentified target, bypassing the suppressive effects of established Ers
- Authors
- Hsiao, A., Darvaux-Hubert, I., Hicks, D., Joux, E., De Freitas, S., Dracos, E., Lizé, J., Perrichet, J., Baas, D., Randlett, O.
- Source
- Full text @ Endocrinology
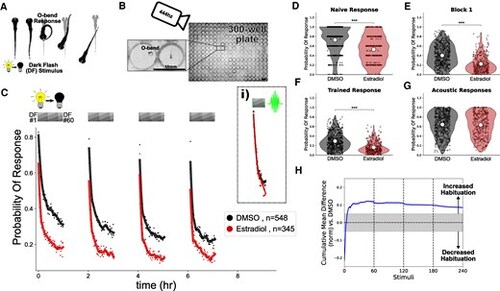
Estradiol increases habituation learning. A) In response to a dark flash (DF), larval zebrafish perform a large turning maneuver termed an “O-bend” response. B) High-throughput setup for recording and quantifying responsiveness using a high-speed camera recording at 444hz observing larvae in 300-well plates. Scale bar = 10 mm. C) Treatment with estradiol (red) results in more rapid and profound decreases in the probability of response to DF stimuli during habituation training relative to DMSO vehicle controls (black). DF stimuli are delivered at 1-minute intervals, in 4 blocks of 60 stimuli, separated by 1 hour of rest (from 0:00-7:00). At 1.5 hours later a block of 30 vibration stimuli are delivered at 1-minute intervals (i). Each dot is the probability of response to one DF. Lines are smoothed in time with a Savitzky–Golay filter (window = 15 stimuli, order = 2). D–G) Distributions responsiveness for different epochs of the experiment. Each dot is the per-fish average of the epoch. Statistical significance was calculated using Mann-Whitney U test, *** = P < .001. D) the naive response to the first 5 DF stimuli; E) the mean response to the remaining DF stimuli in the Block 1 (DFs 6:60); F) the trained response to the last 45 DFs in all 4 training blocks (DFs 16:60,76:120,136:180,196:240); G) the 30 vibration stimuli delivered with a tap from a solenoid on the 300-well plate platform. H) Cumulative mean difference (CMD) plot quantifying relative habituation performance after estradiol treatment. These plots display the cumulative average differences in the mean response across larvae of the treatment group (estradiol) relative to the control group (DMSO). Difference from 0 reflect a divergence in the change in responsiveness across the 240 DF stimuli in the 4 training blocks, with positive values reflecting increased habituation. The width of the line is a bootstrapped 99.5% CI. The gray boxed region reflects the expected nonsignificant effect size (3). Treatment groups are: Estradiol = 10µM estradiol treatment (n = 345 fish); DMSO = 0.1% DMSO vehicle controls (n = 548 fish). |
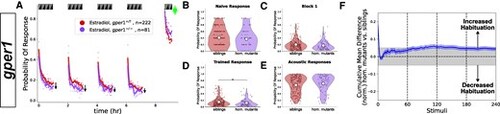
Gper1 mutants do not show habituation deficits after treatment with estradiol. A) Homozygous gper1(−/−) mutants (n = 81 fish, purple) do not show impaired habituation relative to sibling controls (gper1(+/?) = gper1(+/−) and gper1(+/+), n = 222 fish, red). Rather, there is a slight suppression of responsiveness in the mutant group (arrows), indicating weakly increased habituation. Each dot is the probability of response to one stimulus. Lines are smoothed in time with a Savitzky–Golay filter (window = 15 stimuli, order = 2). B-E) No significant differences are observed in the responsiveness distributions for the naive response to the first 5 DF stimuli (B), during the first training block (C), or the vibration response (E), while a subtle but statistically significant decrease in responsiveness is observed in the trained response (D). Statistical significance was calculated using Mann-Whitney U test, * = P < .05. F) Cumulative mean difference (CMD) plot quantifying habituation performance of mutants relative to sibling controls, consistent with slightly increased habituation rate in mutant larvae. |
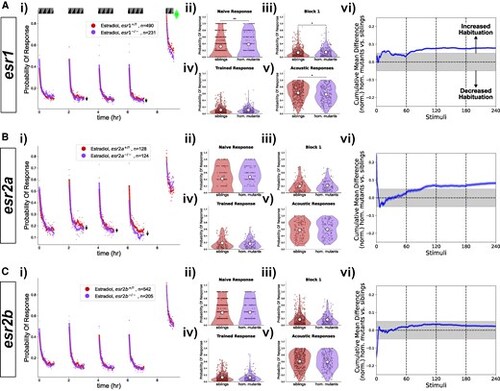
Esr1, esr2a and esr2a mutants do not show habituation deficits after treatment with estradiol. A) Homozygous esr1(−/−) mutants (n = 231 fish) do not show impaired habituation relative to sibling controls (esr1(+/−) = esr1(+/−) and esr1(+/+), n = 490 fish). B) Homozygous esr2a(−/−) mutants (n = 124 fish) do not show impaired habituation relative to sibling controls (esr2a(+/−) = esr2a(+/−) and esr2a(+/+), n = 128 fish). C) Homozygous esr2b(−/−) mutants (n = 205 fish) do not show impaired habituation relative to sibling controls (esr2b(+/−) = esr2b(+/−) and esr2b(+/+), n = 542 fish). i)-vi) For each lettered section: i) Responsiveness to stimuli comparing homozygous mutants to sibling controls (heterozygous or wild-type). Each dot is the probability of response to one stimulus. Lines are smoothed in time with a Savitzky–Golay filter (window = 15 stimuli, order = 2). Suppression of responsiveness is indicated by arrows, potentially reflecting increased habituation. ii)-v) Distributions responsiveness for different epochs of the experiment. Each dot is the per-fish average of the epoch. Statistical significance was calculated using Mann-Whitney U test, * = P < .05, ** = P < .01. ii) the naive response to the first 5 DF stimuli; iii) the mean response to the remaining DF stimuli in the Block 1 (DFs 6:60); iv) the trained response to the last 45 DFs in all 4 training blocks (DFs 16:60,76:120,136:180,196:240); v) the 30 vibration stimuli delivered with a tap from a solenoid on the 300-well plate platform. vi) Cumulative mean difference (CMD) plot quantifying habituation performance of mutants relative to sibling controls. |
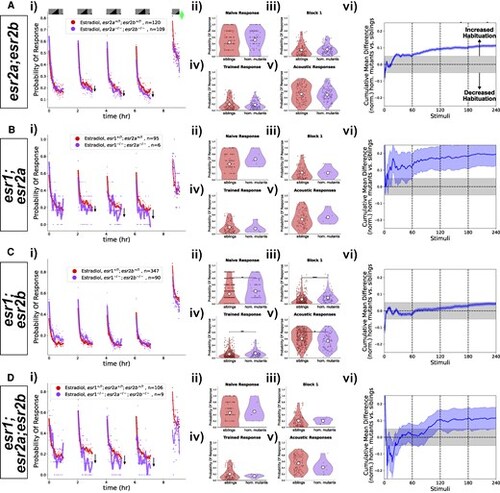
Double and triple mutant combinations of esr1, esr2a, and esr2a do not show habituation deficits after treatment with estradiol. A) Homozygous esr2a(−/−);esr2b(−/−) double mutants (n = 109 fish) do not show impaired habituation relative to double heterozygous or homozygous sibling controls ((+/?);(+/?), n = 120 fish). B) Homozygous esr1(−/−);esr2a(−/−) double mutants (n = 6 fish) do not show impaired habituation relative to double heterozygous or wild-type sibling controls ((+/?);(+/?), n = 95 fish). C) Homozygous esr1(−/−);esr2b(−/−) double mutants (n = 90 fish) do not show impaired habituation relative to double heterozygous or wild-type sibling controls ((+/?);(+/?), n = 347 fish). D) Homozygous esr1(−/−);esr2a(−/−);esr2b(−/−) triple mutants (n = 9 fish) do not show impaired habituation relative to triple heterozygous or wild-type sibling controls ((+/?);(+/?);(+/?), n = 106 fish). i)-vi) For each lettered section: i) Responsiveness to stimuli comparing homozygous mutants to sibling controls (heterozygous or wild-type). Each dot is the probability of response to one stimulus. Lines are smoothed in time with a Savitzky–Golay filter (window = 15 stimuli, order = 2). ii)-v) Distributions responsiveness for different epochs of the experiment. Each dot is the per-fish average of the epoch. Statistical significance was calculated using Mann-Whitney U test, * = P < .05, ** = P < .01, *** = P < .01. ii) the naive response to the first 5 DF stimuli; iii) the mean response to the remaining DF stimuli in the Block 1 (DFs 6:60); iv) the trained response to the last 45 DFs in all 4 training blocks (DFs 16:60,76:120,136:180,196:240); v) the 30 vibration stimuli delivered with a tap from a solenoid on the 300-well plate platform. vi) Cumulative mean difference (CMD) plot quantifying habituation performance of mutants relative to sibling controls. |
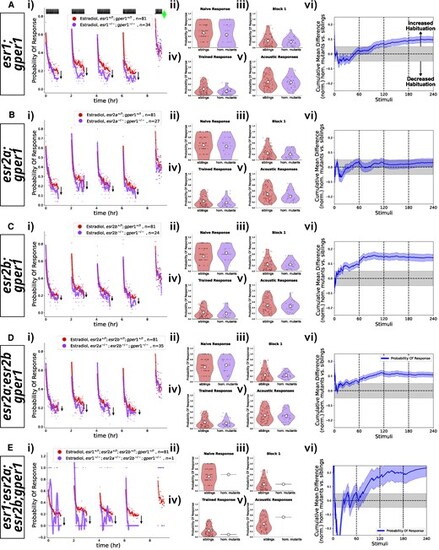
Double, triple, and quadruple mutant combinations of esr1, esr2a, esr2a, and gper1 do not show habituation deficits after treatment with estradiol. A) Homozygous esr1(−/−);gper1(−/−) double mutants (n = 34 fish, purple) do not show impaired habituation relative to double heterozygous or wild-type sibling controls (n = 81 fish, red). B) Homozygous esr2a(−/−);gper1(−/−) double mutants (n = 27 fish, purple) do not show impaired habituation relative to double heterozygous or wild-type sibling controls (n = 81 fish, red). C) Homozygous esr2b(−/−);gper1(−/−) double mutants (n = 24 fish, purple) do not show impaired habituation relative to double heterozygous or wild-type sibling controls (n = 81 fish, red). D) Homozygous esr2a(−/−);esr2b(−/−);gper1(−/−) triple mutants (n = 35 fish, purple) do not show impaired habituation relative to heterozygous or wild-type sibling controls (n = 81 fish, red). E) A single homozygous esr1(−/−);esr2a(−/−);esr2b(−/−);gper1(−/−) quadruple mutant (n = 1 fish, purple) does not appear to show impaired habituation relative to heterozygous or wild-type sibling controls (n = 81 fish, red). i)–vi) For each lettered section: i) Responsiveness to stimuli comparing homozygous mutants to sibling controls (heterozygous or wild-type). Each dot is the probability of response to one stimulus. Lines are smoothed in time with a Savitzky–Golay filter (window = 15 stimuli, order = 2). ii)–v) Distributions responsiveness for different epochs of the experiment. Each dot is the per-fish average of the epoch. Statistical significance was calculated using Mann-Whitney U test. ii) the naive response to the first 5 DF stimuli; iii) the mean response to the remaining DF stimuli in the Block 1 (DFs 6:60); iv) the trained response to the last 45 DFs in all 4 training blocks (DFs 16:60,76:120,136:180,196:240); v) the 30 vibration stimuli delivered with a tap from a solenoid on the 300-well plate platform. vi) Cumulative mean difference (CMD) plot quantifying habituation performance of mutants relative to sibling controls. As mutant larvae were all derived from the same experiments, the sibling control data (red) is the same in A–E). |