
|
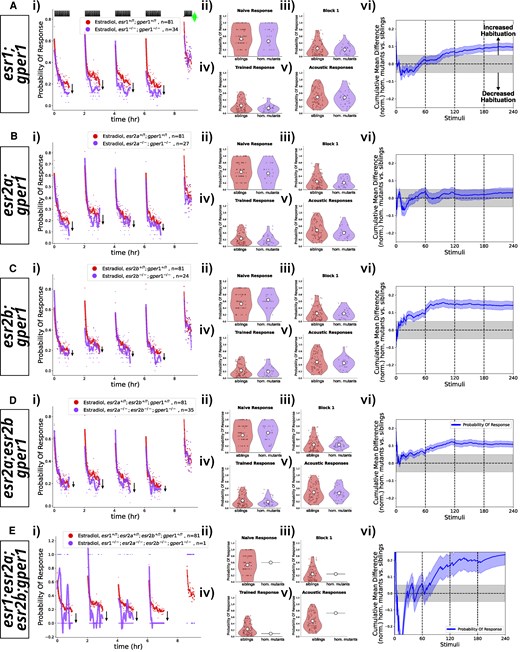
Fig. 5 Double, triple, and quadruple mutant combinations of esr1, esr2a, esr2a, and gper1 do not show habituation deficits after treatment with estradiol. A) Homozygous esr1(−/−);gper1(−/−) double mutants (n = 34 fish, purple) do not show impaired habituation relative to double heterozygous or wild-type sibling controls (n = 81 fish, red). B) Homozygous esr2a(−/−);gper1(−/−) double mutants (n = 27 fish, purple) do not show impaired habituation relative to double heterozygous or wild-type sibling controls (n = 81 fish, red). C) Homozygous esr2b(−/−);gper1(−/−) double mutants (n = 24 fish, purple) do not show impaired habituation relative to double heterozygous or wild-type sibling controls (n = 81 fish, red). D) Homozygous esr2a(−/−);esr2b(−/−);gper1(−/−) triple mutants (n = 35 fish, purple) do not show impaired habituation relative to heterozygous or wild-type sibling controls (n = 81 fish, red). E) A single homozygous esr1(−/−);esr2a(−/−);esr2b(−/−);gper1(−/−) quadruple mutant (n = 1 fish, purple) does not appear to show impaired habituation relative to heterozygous or wild-type sibling controls (n = 81 fish, red). i)–vi) For each lettered section: i) Responsiveness to stimuli comparing homozygous mutants to sibling controls (heterozygous or wild-type). Each dot is the probability of response to one stimulus. Lines are smoothed in time with a Savitzky–Golay filter (window = 15 stimuli, order = 2). ii)–v) Distributions responsiveness for different epochs of the experiment. Each dot is the per-fish average of the epoch. Statistical significance was calculated using Mann-Whitney U test. ii) the naive response to the first 5 DF stimuli; iii) the mean response to the remaining DF stimuli in the Block 1 (DFs 6:60); iv) the trained response to the last 45 DFs in all 4 training blocks (DFs 16:60,76:120,136:180,196:240); v) the 30 vibration stimuli delivered with a tap from a solenoid on the 300-well plate platform. vi) Cumulative mean difference (CMD) plot quantifying habituation performance of mutants relative to sibling controls. As mutant larvae were all derived from the same experiments, the sibling control data (red) is the same in A–E).