
|
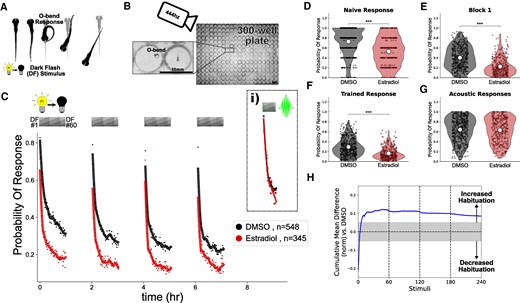
Fig. 1 Estradiol increases habituation learning. A) In response to a dark flash (DF), larval zebrafish perform a large turning maneuver termed an “O-bend” response. B) High-throughput setup for recording and quantifying responsiveness using a high-speed camera recording at 444hz observing larvae in 300-well plates. Scale bar = 10 mm. C) Treatment with estradiol (red) results in more rapid and profound decreases in the probability of response to DF stimuli during habituation training relative to DMSO vehicle controls (black). DF stimuli are delivered at 1-minute intervals, in 4 blocks of 60 stimuli, separated by 1 hour of rest (from 0:00-7:00). At 1.5 hours later a block of 30 vibration stimuli are delivered at 1-minute intervals (i). Each dot is the probability of response to one DF. Lines are smoothed in time with a Savitzky–Golay filter (window = 15 stimuli, order = 2). D–G) Distributions responsiveness for different epochs of the experiment. Each dot is the per-fish average of the epoch. Statistical significance was calculated using Mann-Whitney U test, *** = P < .001. D) the naive response to the first 5 DF stimuli; E) the mean response to the remaining DF stimuli in the Block 1 (DFs 6:60); F) the trained response to the last 45 DFs in all 4 training blocks (DFs 16:60,76:120,136:180,196:240); G) the 30 vibration stimuli delivered with a tap from a solenoid on the 300-well plate platform. H) Cumulative mean difference (CMD) plot quantifying relative habituation performance after estradiol treatment. These plots display the cumulative average differences in the mean response across larvae of the treatment group (estradiol) relative to the control group (DMSO). Difference from 0 reflect a divergence in the change in responsiveness across the 240 DF stimuli in the 4 training blocks, with positive values reflecting increased habituation. The width of the line is a bootstrapped 99.5% CI. The gray boxed region reflects the expected nonsignificant effect size (3). Treatment groups are: Estradiol = 10µM estradiol treatment (n = 345 fish); DMSO = 0.1% DMSO vehicle controls (n = 548 fish).