
- Title
-
p21, ccng1, foxo3b, and fbxw7 contribute to p53-dependent cell cycle arrest
- Authors
- Wang, J., Li, Z., Thomas, H.R., Fan, K., Thompson, R.G., Ma, Y., Crossman, D., Yoder, B.K., Parant, J.M.
- Source
- Full text @ iScience
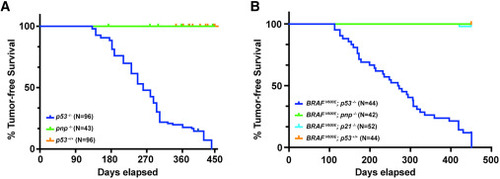
puma−/−; noxa−/−; p21−/− zebrafish are not predisposed to spontaneous tumors (A) Kaplan-Meier tumor-free survival of p53−/− (blue curve, N = 96, T50 = 261 days) zebrafish compared with puma−/−; noxa−/−; p21−/− (called pnp−/−, N = 43, green) and wildtype allele (N = 96, orange). (B) Kaplan-Meier tumor-free survival of BRAFV600E; p53−/− (blue curve, N = 44, T50 = 271 days) zebrafish compared with BRAFV600E; puma−/−; noxa−/−; p21−/− (called BRAFV600E; pnp−/−, N = 42, green), BRAFV600E; p21−/− (N = 52, green), and wildtype allele (N = 44, orange). Long-rank statistic test was done. ∗∗∗∗, p-value between p53−/− and pnp−/− < 0.0001 and p-value between p53−/− and p53+/+ < 0.0001. ∗∗∗∗, p-value between BRAFV600E; p53−/− and BRAFV600E; pnp−/− < 0.0001, p-value between p-value between BRAFV600E; p53−/− and BRAFV600E; p21−/− < 0.0001, and BRAFV600E; p53−/− and BRAFV600E; p53+/+ < 0.0001. |
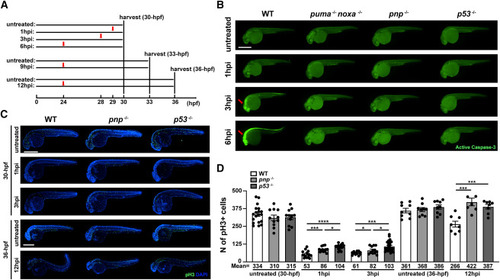
Loss of puma, noxa, and p21 provide resistance to p53-mediated induction of apoptosis and partially resistance to p53-mediated cell-cycle arrest (A) Experimental workflow showing how samples were harvested. 29-, 27- and 24-h post fertilization (hpf) wildtype, puma−/−; noxa−/−, pnp−/− and p53−/− zebrafish embryos were treated with 30 Gy IR-irradiation and fixed at 1-, 3-, 6-, 9- and 12-h post IR-treatment (hpi, 1hpi, 3hpi and 6hpi panels). (B) Representative images of anti-active Caspase-3 staining on 30-hpf zebrafish embryos for each group. Arrows in WT points out active apoptotic area in head region at 3 and 6 hpi. Scale bar: 500μM. (C) Representative images of phospho-histone H3 (pH3)-stained 30-hpf (1 and 3 hpi) or 36-hpf (12 hpi) zebrafish embryos for each group. Experimental design showing in Figures 2A and S2A. Scale bar: 500μM. (D) Quantification of pH3 positive cells in treated and untreated WT, pnp−/− and p53−/− embryos for each group. Each dot represents an individual. The average number of pH3+ cells (Mean) were indicated in each group. Bars represent mean ± SEM. ∗, p < 0.05. ∗∗∗, p < 0.001.∗∗∗∗, p < 0.0001. |
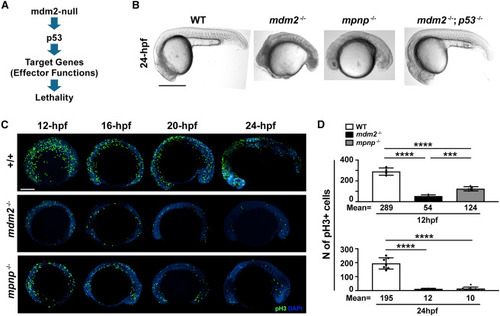
Loss of p21 partially rescues p53-dependent mdm2-null induced cell-cycle arrest (A) The conceptional diagram of mdm2-null induced embryonic lethality. Loss of mdm2 elevates p53 protein levels to induce downstream targets and effector functions to render the lethality. (B) Representative gross images of 24-hpf mdm2+/+, mdm2−/−; puma−/−; noxa−/−; p21−/− (mpnp−/−) and mdm2−/−; p53−/− embryos. Scale bar: 500μM. (C) pH3-stained mdm2+/+, mdm2−/−; mpnp−/− embryos at 12-, 16-, 20- and 24-hpf. Scale bar: 200μM. (D) Quantification of pH3 positive cells at 12 hpf (Top panel) and at 24 hpf (bottom panel). Each dot represents an individual. Bars represent mean ± SEM. ∗∗∗, p < 0.001.∗∗∗∗, p < 0.0001. Not statistical significance between mdm2−/− and mpnp−/− at 24 hpf. |
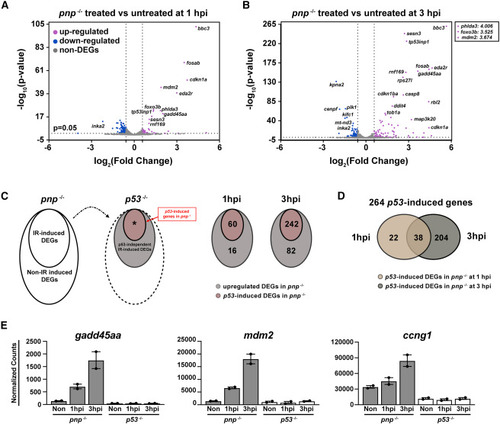
Defining IR induced zebrafish early responsive p53-upregulated genes (A and B) Volcano plots showing 30-hpf zebrafish pnp−/− embryos with the treated versus untreated at 1 (A) and 3 hpi (B). The cutoff was set as fold change ≥2 or ≤ −2 and p value <0.05. Upregulated DEGs were color-labeled with magenta and the downregulated were labeled with blue. The gene symbol of some TOP DEGs was indicated on the plot. The -log10(p-value) of phlda3, foxo3b and mdm2 treated versus untreated at 3 hpi is above 300. Their log2(Fold change) values were pointed out (top right square). (C) Schematic of the method used to create Venn diagrams for p53-upregulated DEGs in pnp−/− at 1 and 3 hpi (left panel). Venn graphs for the DEGs (right panel). The cut-off is fold change ≥1.5 and q < 0.05. (D) Venn graph showing 264 p53-induced genes in pnp−/− between 1 and 3 hpi. (E) Representative plots showing well-established p53 targets, including gadd45aa, mdm2 and ccng1, in pnp−/− but not p53−/− datasets in response to IR treatment. |
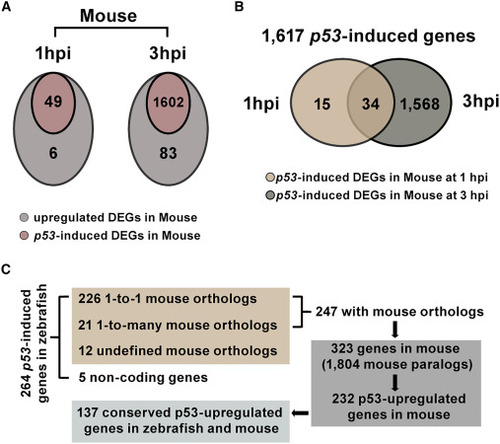
Defining conserved p53-upregulated genes in zebrafish and mouse (A) Venn graphs representing p53-upregulated DEGs in mouse p53+/+ at 1 and 3 hpi. The cut-off is fold change ≥1.5 and q < 0.05. (B) Venn graph showing 1,617 p53-induced genes in mouse p53+/+ between 1 and 3 hpi. (C) The diagram showing the analysis on mouse orthologs of p53-upregulated DEGs in pnp−/− zebrafish embryos at 1 and 3 hpi. For 264 p53-upregulated DEGs defined in zebrafish at 1 or 3 hpi, 247 of them are with mouse orthologs. Among them, 226 genes have one ortholog, and 21 of them are with multiple orthologs. 12 did not define orthologs in mouse. Five of them are non-coding genes. And 247 zebrafish p53-upregulated DEGs are corresponding to 323 mouse orthologs and 1,804 mouse paralogs. Among them, 232 genes are upregulated in mouse WT but not in p53−/− treated versus untreated. Finally, defining 137 zebrafish p53-induced DEGs are also conserved upregulated by p53 in mouse. |
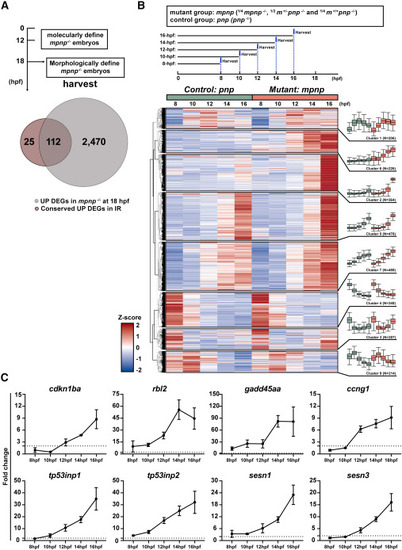
Comparing 137 conserved p53 dependent IR induced genes with DEGs in mpnp−/− datasets (A) Venn graph displaying the overlapping genes between 137 conserved UP DEGs in both zebrafish and mouse with IR-irradiation and 2,582 upregulated (UP) DEGs in mpnp−/− versus sibling controls at 18 hpf. Experimental timeline showing the timepoint that distinguish mpnp−/− embryos from sibling controls and how to harvest RNA samples at the time (Top panel). (B) Heatmap showing transcriptional changes for 2,582 DEGs over time in early mpnp−/− datasets (8, 10, 12, 14, and 16 hpf). Each timepoint was measured in duplicate, and the averages of the duplicates were used for each group. Z-scores, calculated from TPM values calculated across all samples, were used to standardize gene expression levels before clustering. The experimental workflow for sample collection is shown in the top panel. Note that mutant samples at each timepoint were diluted 4-fold by their sibling controls (¼ mpnp−/− and ¾ sibling controls). Genes with similar expression patterns over time were grouped into eight clusters, with their trends and cluster sizes shown in the right panel. (C) Line graphs showing the kinetics of 8 out of 24 GOIs in early mpnp datasets, with the dashed line indicating a fold change of 2. Expected counts calculated with RSEM were used for creating line graphs. Line graphs for the remaining 16 GOIs are shown in Figure S8B. |
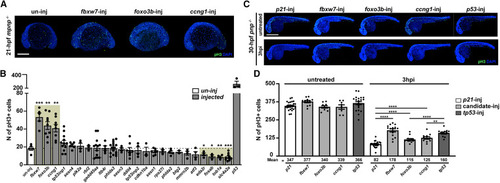
fbxw7, foxo3b and ccng1 G0 crispants mitigate p53-mediated cell-cycle arrest (A) Representative images showing pH3-stained un-injected (control, un-inj) and injected mpnp−/− embryos at 21 hpf. Scale bar: 250μM. (B) Quantification of pH3 positive cells in injected mpnp−/− embryos for 24 GOIs. un-inj (negative control) and the p53 guides-injected (p53, positive control). (C) Representative images representing pH3-stained, IR-irradiation treated or untreated, four-guide injected pnp−/− embryos at 30 hpf. Scale bar: 500μM. (D) Quantification of pH3 positive cells in injected pnp−/− embryos for fbxw7, foxo3b and ccng1. p21-inj (negative control) and p53-inj (positive control). Each dot represents an individual. Bars represent mean ± SEM. ∗, p < 0.05. ∗∗, p < 0.01.∗∗∗, p < 0.001.∗∗∗∗, p < 0.0001. |