
|
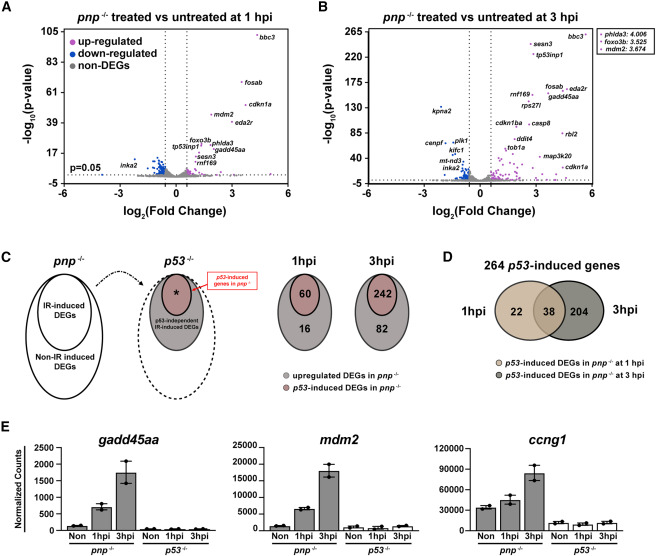
Fig. 4 Defining IR induced zebrafish early responsive p53-upregulated genes (A and B) Volcano plots showing 30-hpf zebrafish pnp−/− embryos with the treated versus untreated at 1 (A) and 3 hpi (B). The cutoff was set as fold change ≥2 or ≤ −2 and p value <0.05. Upregulated DEGs were color-labeled with magenta and the downregulated were labeled with blue. The gene symbol of some TOP DEGs was indicated on the plot. The -log10(p-value) of phlda3, foxo3b and mdm2 treated versus untreated at 3 hpi is above 300. Their log2(Fold change) values were pointed out (top right square). (C) Schematic of the method used to create Venn diagrams for p53-upregulated DEGs in pnp−/− at 1 and 3 hpi (left panel). Venn graphs for the DEGs (right panel). The cut-off is fold change ≥1.5 and q < 0.05. (D) Venn graph showing 264 p53-induced genes in pnp−/− between 1 and 3 hpi. (E) Representative plots showing well-established p53 targets, including gadd45aa, mdm2 and ccng1, in pnp−/− but not p53−/− datasets in response to IR treatment.