FIGURE SUMMARY
Title

Mongolian medicine Eerdun-Wurile promotes myocardial regeneration by regulating MVDA in zebrafish

Authors
Chen, X., Li, X., Sun, J., Lin, Y., Li, Y., Lv, X., Zhao, R., Gu, X., Wang, W., Xie, Y., Xie, W., Bade, R., Jiang, S., Liu, X., Zou, B., Bi, Y., Shao, G., Bai, H., Zhu, W., Jia, X.
Source
Full text @ Cell Regen (Lond)

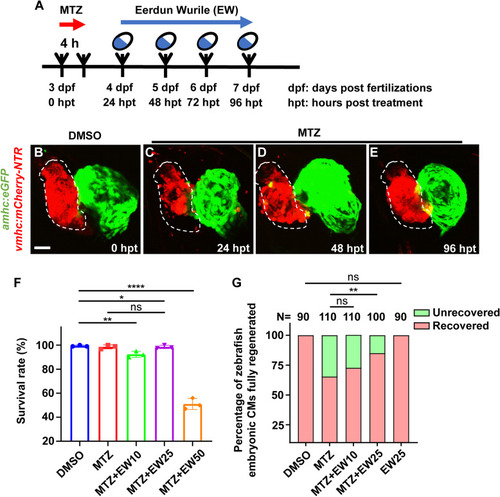
Successful construction of a myocardial injury-repair model. Schematic of the experimental timeline (A). Representative images of ventricular morphology of zebrafish in the control (B) and ventricular ablation (C-E) groups after metronidazole (MTZ) treatment. Survival rates of zebrafish after treatment with different concentrations of EW (F). Statistical analysis of data for complete myocardial regeneration at different Eerdun-Wurile (EW) concentrations (G). *, P < 0.05; **, P < 0.01; ****, P < 0.0001. Scale bar, 20 μm

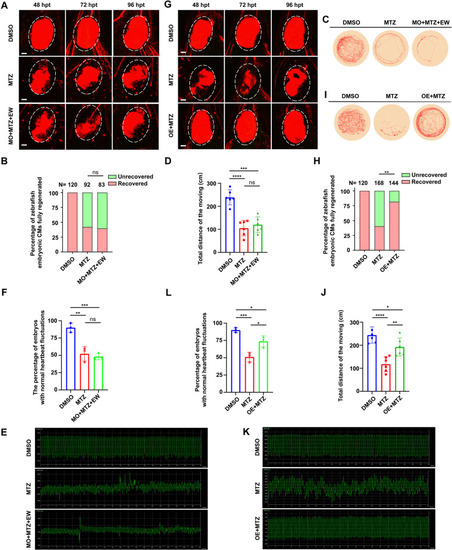
Eerdun-Wurile (EW) promotes myocardial injury repair. Representative images of ventricular morphology of embryos in the control (A-C), metronidazole (MTZ) ablation (D-F), EW treatment (G-I) groups and EW alone (J-L). Statistical analysis of myocardial regeneration at 72 hpt (M). Statistical analysis of myocardial regeneration at 96 hpt (N). **, P < 0.01. Scale bar, 20 μm

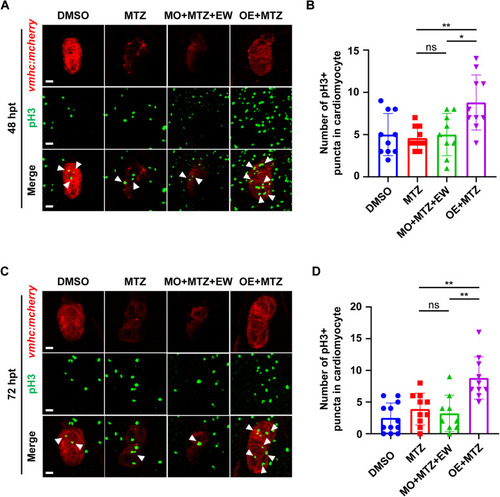
Eerdun-Wurile (EW) reduces apoptosis of cardiomyocytes and promotes proliferation of cardiomyocytes. Representative images of TUNEL staining in the control, metronidazole (MTZ) ablation, EW treatment groups and EW alone at 48 hpt (A), 72 hpt (C). White arrows indicate TUNEL positive (TUNEL +) cardiomyocytes (CMs). Statistical analysis of apoptosis cardiomyocyte at 48 (B), 72 hpt (D). Immunofluorescent analysis of cardiomyocytes proliferation at 48 (E), 72 (G), and 96 hpt (I). White arrows indicate phosphorylated histone H3 positive (pH3 +) cardiomyocytes (CMs). Statistical analysis of cardiomyocytes proliferation at 48 (F), 72 (H), and 96 hpt (J). *, P < 0.05; **, P < 0.01. Scale bar, 20 μm

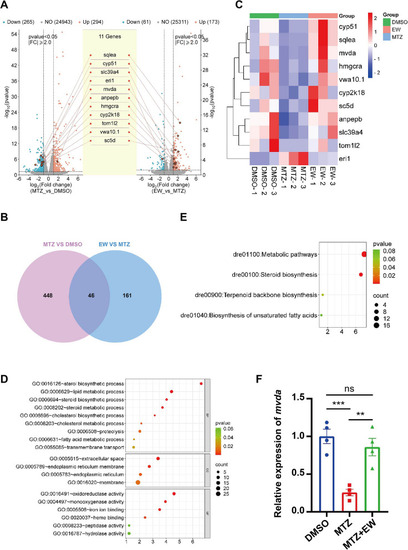
Transcriptome sequencing. A Heat map showing all the differentially expressed genes (DEGs) identified by RNA-sequencing. B Volcano plot showing the differentially expressed genes (DEGs) (criteria: P < 0.05, Log2FC fold change > 1 or < -1) altered in metronidazole (MTZ) group and the Eerdun-Wurile (EW) treatment group at 48 hpt. C Venn plot showing the strategy for screening the opposite DEGs in MTZ and EW group. Gene ontology (GO) (D) and Kyoto Encyclopedia of Genes and Genomes (KEGG) (E) analysis show the enrichment results of 46 opposite DEGs obtained in (C). F Quantitative PCR analysis was performed to confirm the changes in mevalonate diphosphate decarboxylase a (mvda) expression in the different groups (RNA-sequencing results). **, P < 0.01; ***, P < 0.001

mvda knockdown/ overexpression affects heart regeneration in zebrafish. Representative images of ventricular morphology of zebrafish in DMSO, MTZ, and MO + MTZ + EW (A). Statistical analysis of ventricular regeneration (B). C Representative traces of individual zebrafish from different groups during the thigmotaxis test. D Statistical analysis of the movement trajectories. Representative heartbeat fluctuations charts of zebrafish in DMSO, MTZ, MO + MTZ + EW (E). Statistical analysis of the proportion of embryos with normal heartbeat fluctuations (F). Representative images of ventricular morphology of zebrafish in DMSO, MTZ, OE + MTZ (G). Statistical analysis of ventricular regeneration (H). I Representative traces of individual zebrafish from different groups during the thigmotaxis test. J Statistical analysis of the movement trajectories. Representative heartbeat fluctuations charts of zebrafish in DMSO, MTZ, OE + MTZ (K). Statistical analysis of the proportion of embryos with normal heartbeat fluctuations (L). *, P < 0.05; **, P < 0.01; ***, P < 0.001, ****, P < 0.0001. Scale bar: 20 μm

mvda affects the proliferation of cardiomyocytes. Immunofluorescent analysis of cardiomyocytes proliferation at 48 (A), 72 hpt (C) in mvda overexpression and knocking down group. White arrows indicate phosphorylated histone H3 positive (pH3 +) cardiomyocytes (CMs). Statistical analysis of cardiomyocytes proliferation at 48 (B), 72 hpt (D),. *, P < 0.05; **, P < 0.01. Scale bar, 20 μm

Acknowledgments
This image is the copyrighted work of the attributed author or publisher, and ZFIN has permission only to display this image to its users. Additional permissions should be obtained from the applicable author or publisher of the image. Full text @ Cell Regen (Lond)